-
-
-
-
Scenarios for Flexed or Pooled license expiry and connectivity issues behavior
-
Configure NetScaler Console as the Flexed or Pooled license server
This content has been machine translated dynamically.
Dieser Inhalt ist eine maschinelle Übersetzung, die dynamisch erstellt wurde. (Haftungsausschluss)
Cet article a été traduit automatiquement de manière dynamique. (Clause de non responsabilité)
Este artículo lo ha traducido una máquina de forma dinámica. (Aviso legal)
此内容已经过机器动态翻译。 放弃
このコンテンツは動的に機械翻訳されています。免責事項
이 콘텐츠는 동적으로 기계 번역되었습니다. 책임 부인
Este texto foi traduzido automaticamente. (Aviso legal)
Questo contenuto è stato tradotto dinamicamente con traduzione automatica.(Esclusione di responsabilità))
This article has been machine translated.
Dieser Artikel wurde maschinell übersetzt. (Haftungsausschluss)
Ce article a été traduit automatiquement. (Clause de non responsabilité)
Este artículo ha sido traducido automáticamente. (Aviso legal)
この記事は機械翻訳されています.免責事項
이 기사는 기계 번역되었습니다.책임 부인
Este artigo foi traduzido automaticamente.(Aviso legal)
这篇文章已经过机器翻译.放弃
Questo articolo è stato tradotto automaticamente.(Esclusione di responsabilità))
Translation failed!
Integration with Splunk
You can now integrate NetScaler Console with Splunk to view analytics for:
-
WAF violations
-
Bot violations
-
SSL Certificate Insights
-
Gateway insights
-
Events and metrics
-
HDX™ insights
-
NetScaler® Console Audit Logs
Splunk add-on enables you to:
-
Combine all other external data sources.
-
Provide greater visibility of analytics in a centralized place.
NetScaler Console collects Bot, WAF, SSL events, and sends to Splunk periodically. The Splunk Common Information Model (CIM) add-on converts the events to CIM compatible data. As an administrator, using the CIM compatible data, you can view the events in the Splunk dashboard.
For a successful integration, you must:
Configure Splunk to receive data from NetScaler Console on-prem
In Splunk, you must:
-
Setup the Splunk HTTP event collector endpoint and generate a token
-
Install the CIM normalizer (applicable only for WAF and bot insights)
Setup the Splunk HTTP event collector endpoint and generate a token
You must first setup the HTTP event collector in Splunk. This setup enables the integration between the NetScaler Console and Splunk to send the data. Next, you must generate a token in Splunk to:
-
Enable authentication between NetScaler Console and Splunk.
-
Receive data through the event collector endpoint.
-
Log on to Splunk.
-
Navigate to Settings > Data Inputs > HTTP event collector and click Add new.
-
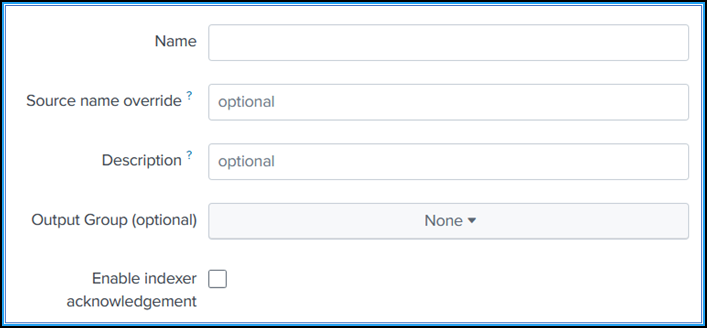
Specify the following parameters:
-
Name: Specify a name of your choice.
-
Source name override (optional): If you set a value, it overrides the source value for HTTP event collector.
-
Description (optional): Specify a description.
-
Output Group (optional): By default, this option is selected as None.
-
Enable indexer acknowledgement: NetScaler Console does not support this option. We recommend not to select this option.
-
-
Click Next.
-
Optionally, you can set additional input parameters in the Input Settings page.
-
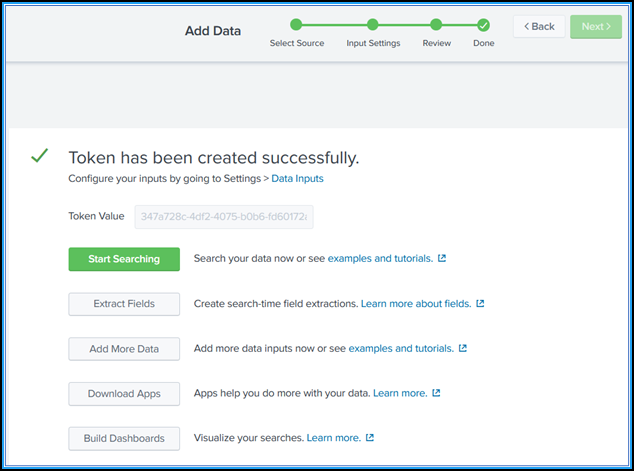
Click Review to verify the entries and then click Submit.
A token gets generated. You must use this token when you add details in NetScaler Console.
Install the Splunk Common Information Model
In Splunk, you must install the Splunk CIM add-on. This add-on ensures that the data received from NetScaler Console to normalize the ingested data and match a common standard using the same field names and event tags for equivalent events.
Note
You can ignore this step if you have already installed the Splunk CIM add-on.
-
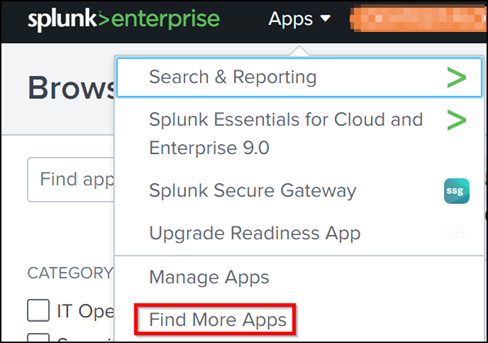
Log on to Splunk.
-
Navigate to Apps > Find More Apps.
-
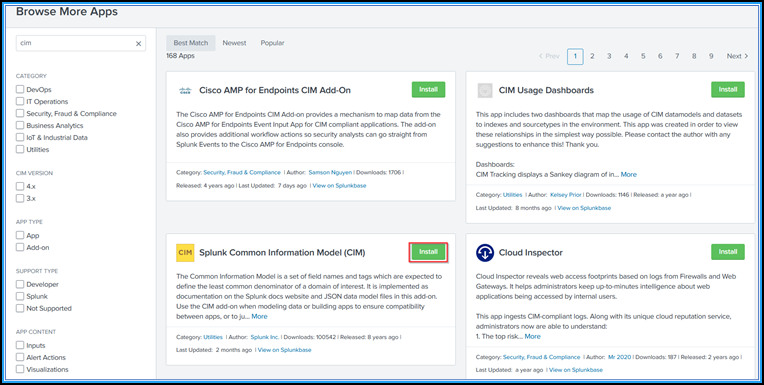
Type CIM in the search bar and press Enter to get the Splunk Common Information Model (CIM) add-on, and click Install.
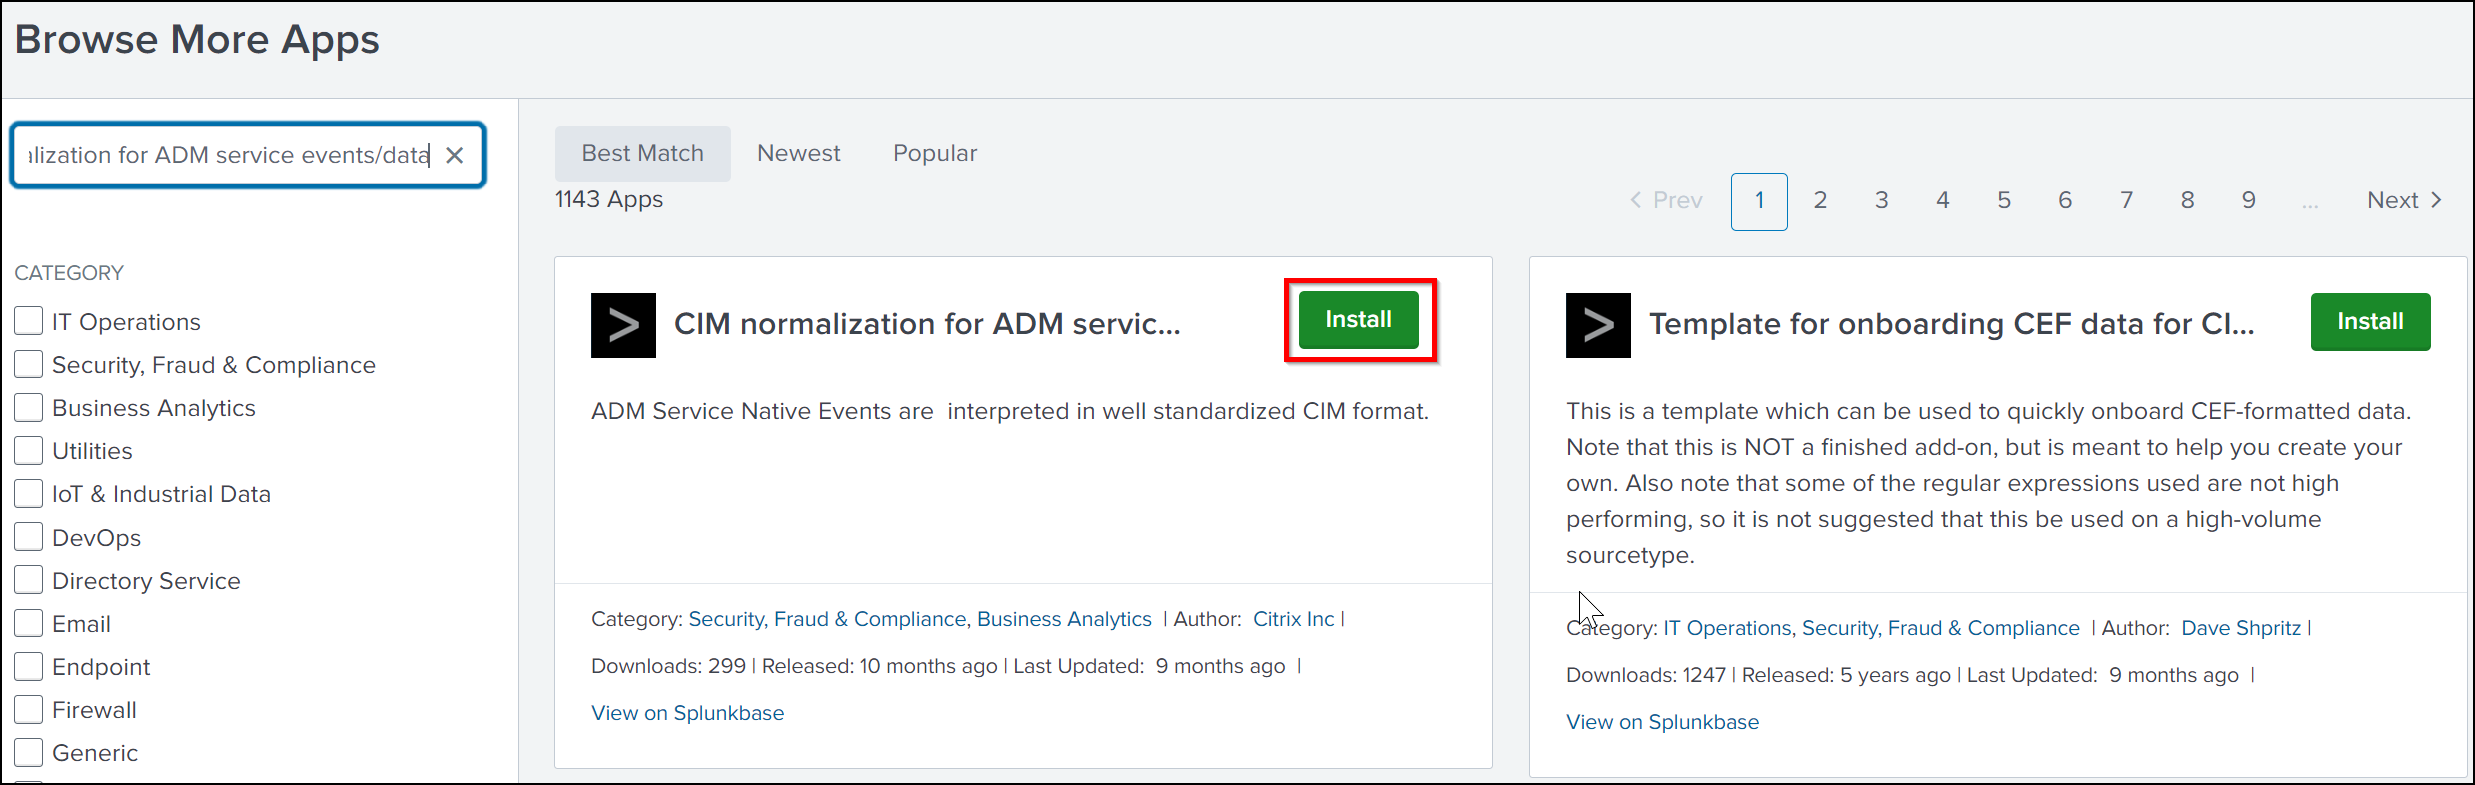
Install the CIM normalizer
The CIM normalizer is an additional plug-in that you must install to view the WAF and bot insights in Splunk.
-
In the Splunk portal, navigate to Apps > Find More Apps.
-
Type CIM normalization for NetScaler Console service events/data in the search bar and press Enter to get the add-on, and click Install.
Prepare a sample dashboard in Splunk
After you install the Splunk CIM, you must prepare a sample dashboard using a template for WAF and Bot, SSL Certificate insights, and events and metrics. You can download the dashboard template (.tgz) file, use any editor (for example, notepad) to copy its contents, and create a dashboard by pasting the data in Splunk.
Note:
The following procedure to create a sample dashboard is applicable for all use cases. You must use the required
jsonfile.
-
Log on to Citrix downloads page and download the sample dashboard available under Sample Dashboards for 3rd party Endpoints.
-
Extract the file, open the
jsonfile using any editor, and copy the data from the file.After you extract, you get three
jsonfiles. Use the:-
adm_splunk_security_violations.jsonfile to create WAF and Bot sample dashboard. -
adm_splunk_ssl_certificate.jsonfile to create SSL certificate insight sample dashboard. -
adm_splunk_events_and_metrics_history.jsonfile to create NetScaler Console events and metrics dashboard.
-
-
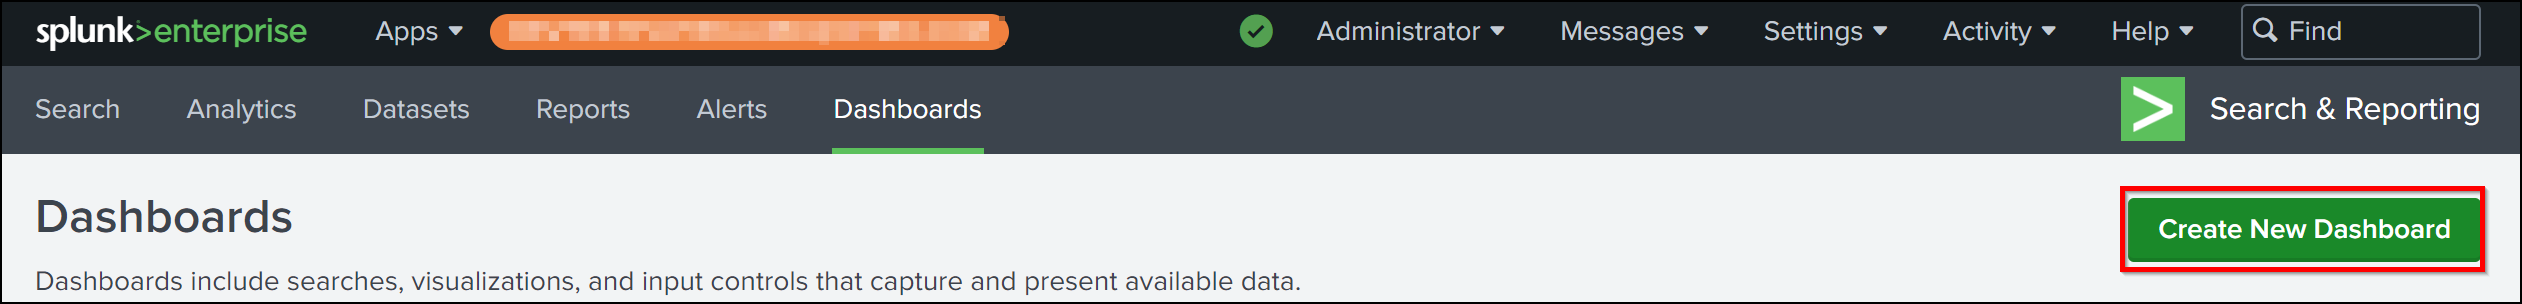
In the Splunk portal, navigate to Search & Reporting > Dashboards and then click Create New Dashboard.
-
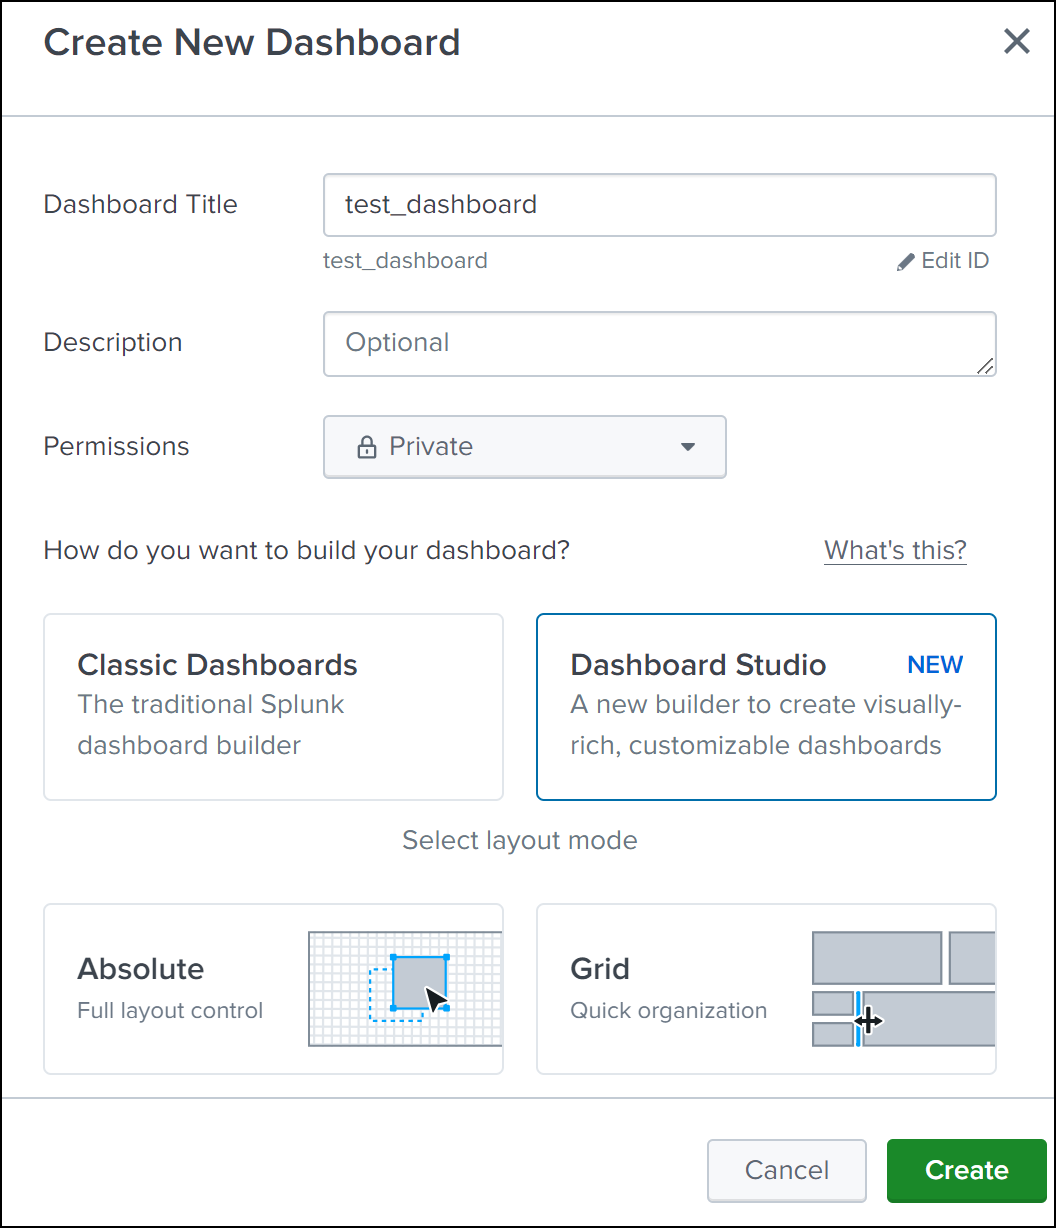
In the Create New Dashboard page, specify the following parameters:
-
Dashboard Title - Provide a title of your choice.
-
Description - Optionally, you can provide a description for your reference.
-
Permission - Select Private or Shared in App based on your requirement.
-
Select Dashboard Studio.
-
Select any one layout (Absolute or Grid), and then click Create.
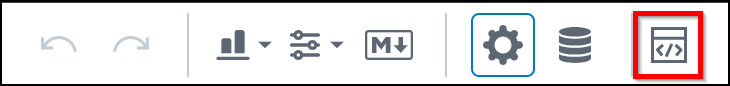
After you click Create, select the Source icon from the layout.
-
-
Delete the existing data, paste the data that you copied in step 2, and click Back.
-
Click Save.
You can view the sample dashboard.
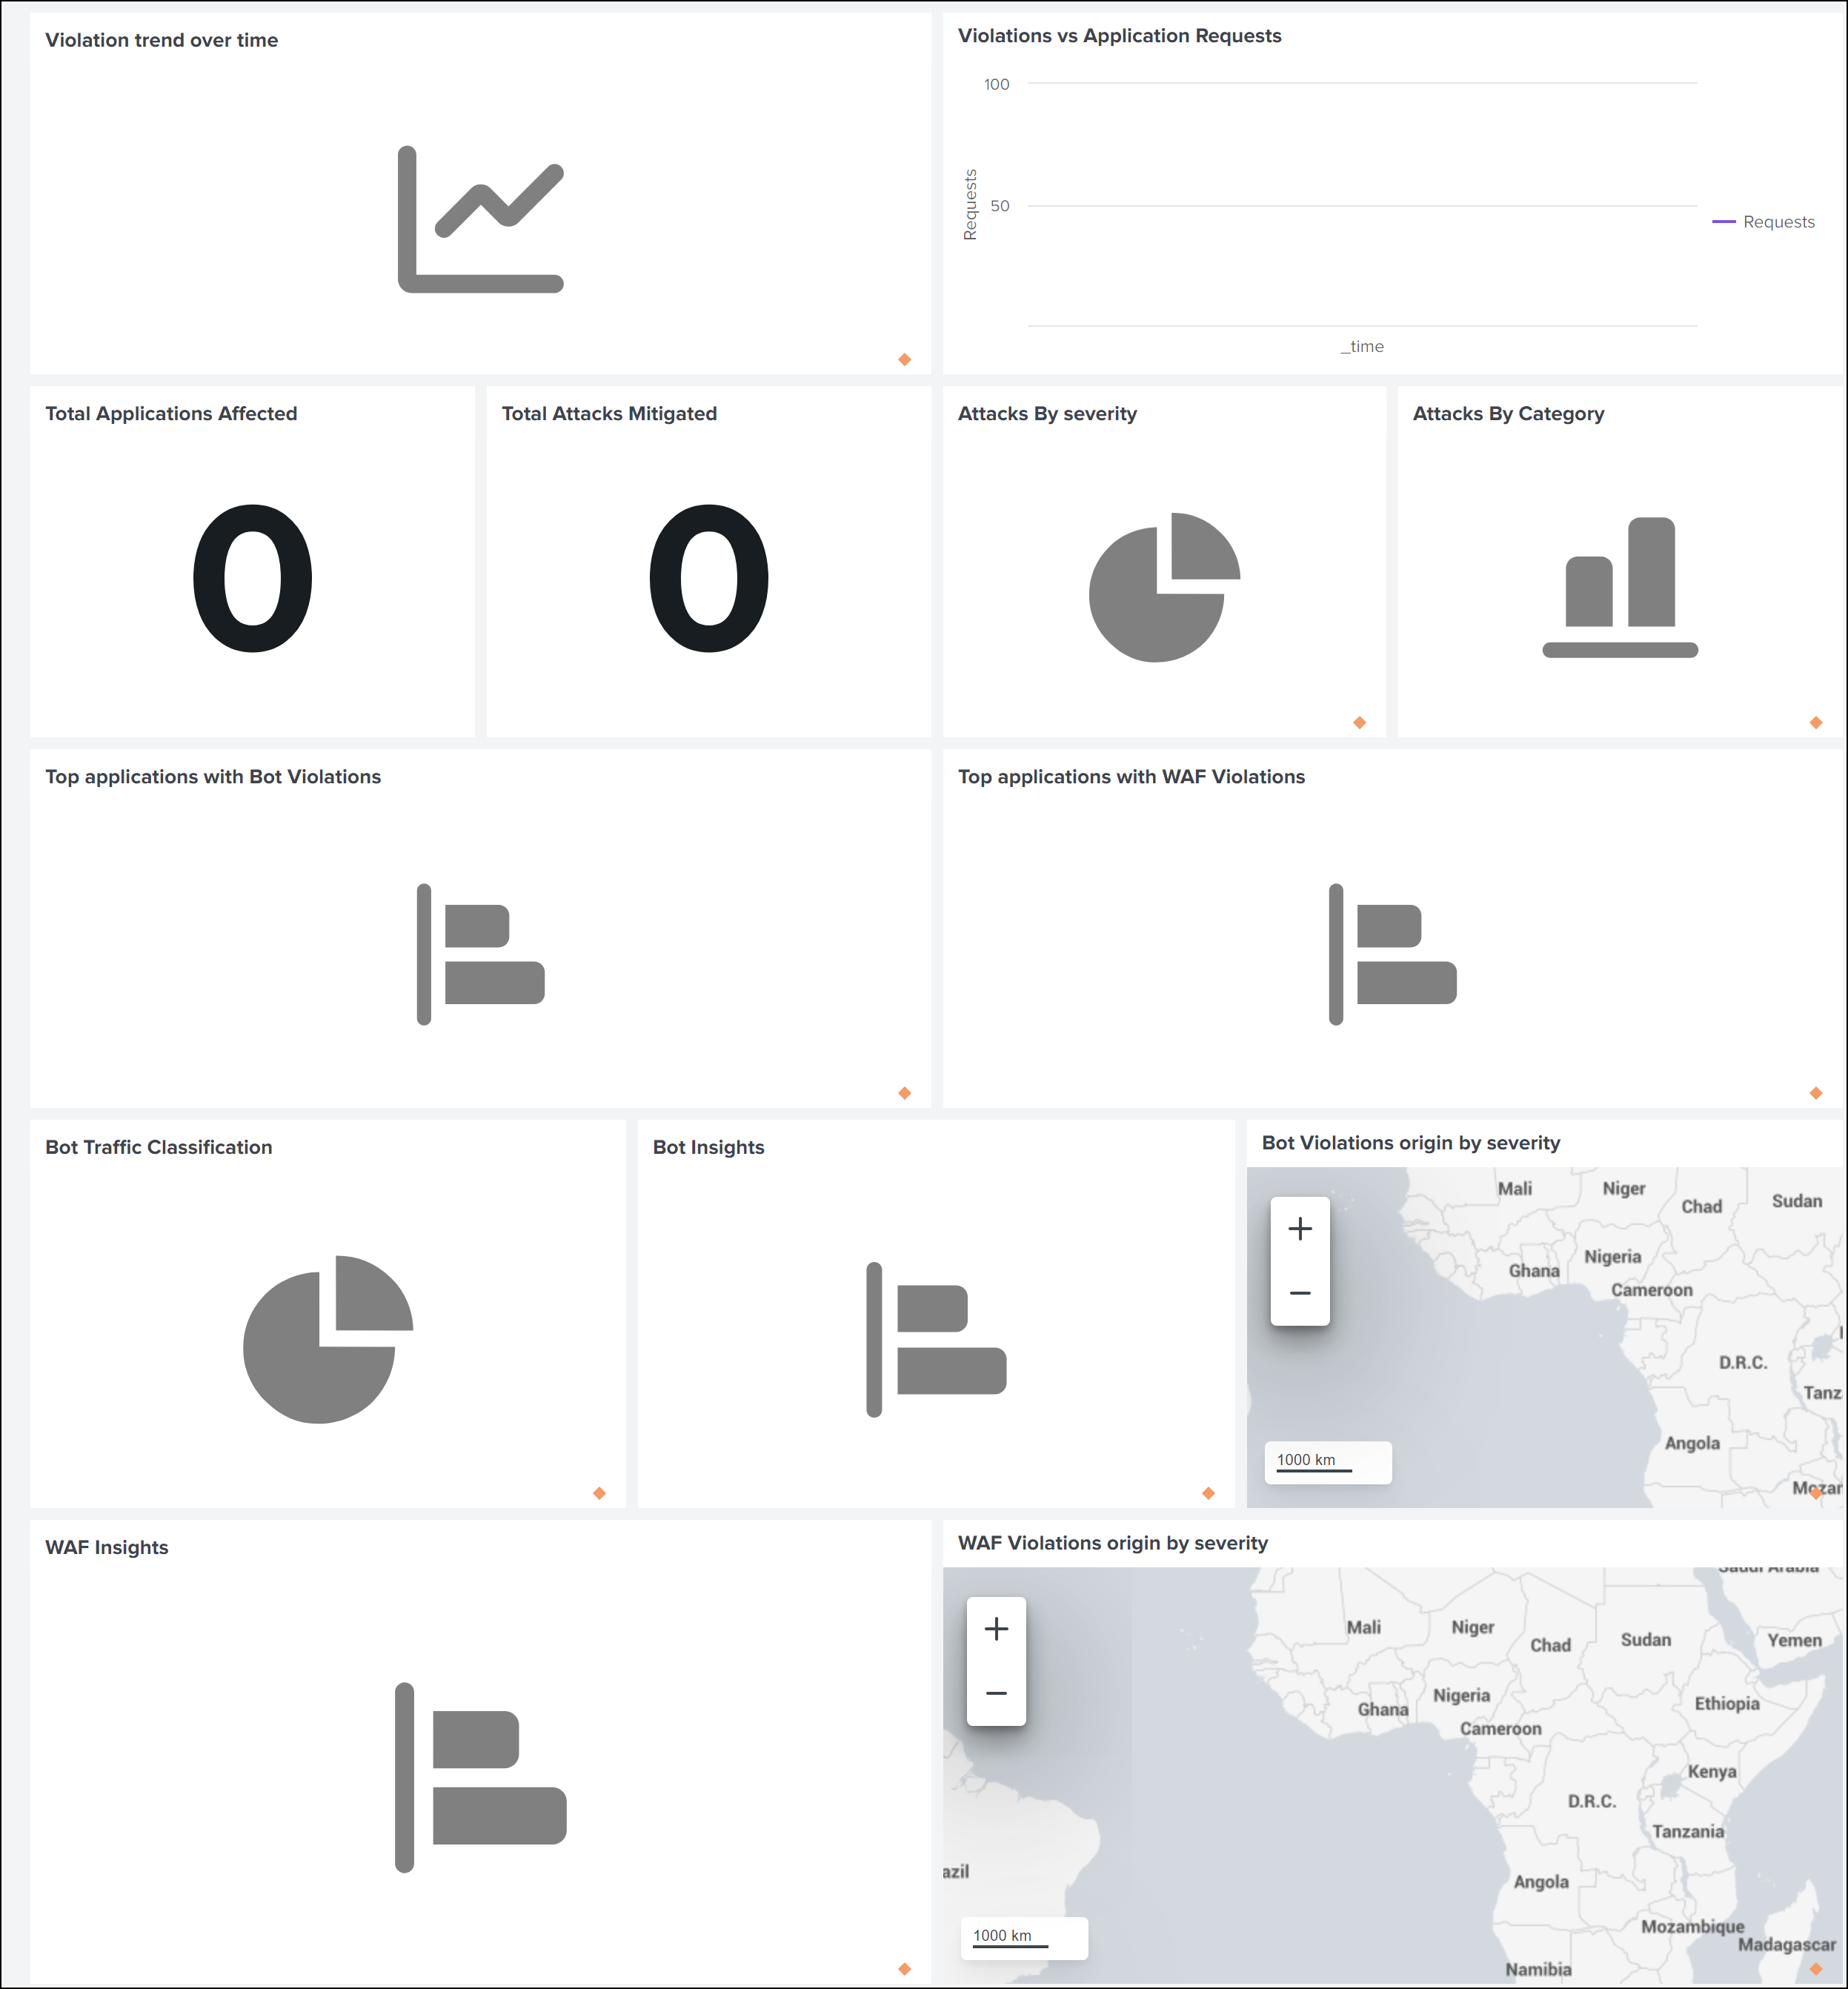
The following is an example sample dashboard for WAF and bot.
Configure NetScaler Console on-prem to export data to Splunk
You now have everything ready in Splunk. The final step is to configure NetScaler Console by creating a subscription and adding the token.
Upon completion of the following procedure, you can view the updated dashboard in Splunk that is currently available in your NetScaler Console:
-
Log on to NetScaler Console.
-
Navigate to Settings > Observability Integration.
-
In the Integrations page, click Add.
-
In the Create Subscription page, specify the following details:
-
Specify a name of your choice in the Subscription Name field.
-
Select NetScaler Console as the Source and click Next.
-
Select Splunk and click Configure. In the Configure Endpoint page:
-
End Point URL – Specify the Splunk end point details. The end point must be in the https://SPLUNK_PUBLIC_IP:SPLUNK_HEC_PORT/services/collector/event format.
Note:
It is recommended to use HTTPS for security reasons.
-
SPLUNK_PUBLIC_IP – A valid IP address configured for Splunk.
-
SPLUNK_HEC_PORT – Denotes the port number that you have specified during the HTTP event endpoint configuration. The default port number is 8088.
-
Services/collector/event – Denotes the path for the HEC application.
-
-
Authentication token – Copy and paste the authentication token from Splunk.
-
Click Submit.
-
-
Click Next.
-
Click Add Insights and in the Select Feature tab, you can select the features that you want to export and click Add Selected.
Note:
If you have selected NetScaler Console Audit Logs, you can select Daily or Hourly for the frequency to export audit logs to Splunk.
-
Click Next.
-
In the Select Instance tab, you can either choose Select All Instances or Custom select, and then click Next.
-
Select All Instances - Exports data to Splunk from all the NetScaler instances.
-
Custom select - Enables you to select the NetScaler instances from the list. If you select specific instances from the list, then the data is exported to Splunk only from the selected NetScaler instances.
-
-
Click Submit.
Note:
The data for the selected insights gets pushed to Splunk immediately after the violations are detected in NetScaler Console.
-
View dashboards in Splunk
After you complete the configuration in NetScaler Console, the data gets exported from NetScaler Console and the events appear in Splunk.
You are all set to view the updated dashboard in Splunk without any additional steps.
Go to Splunk and click the dashboard that you have created to view the updated dashboard.
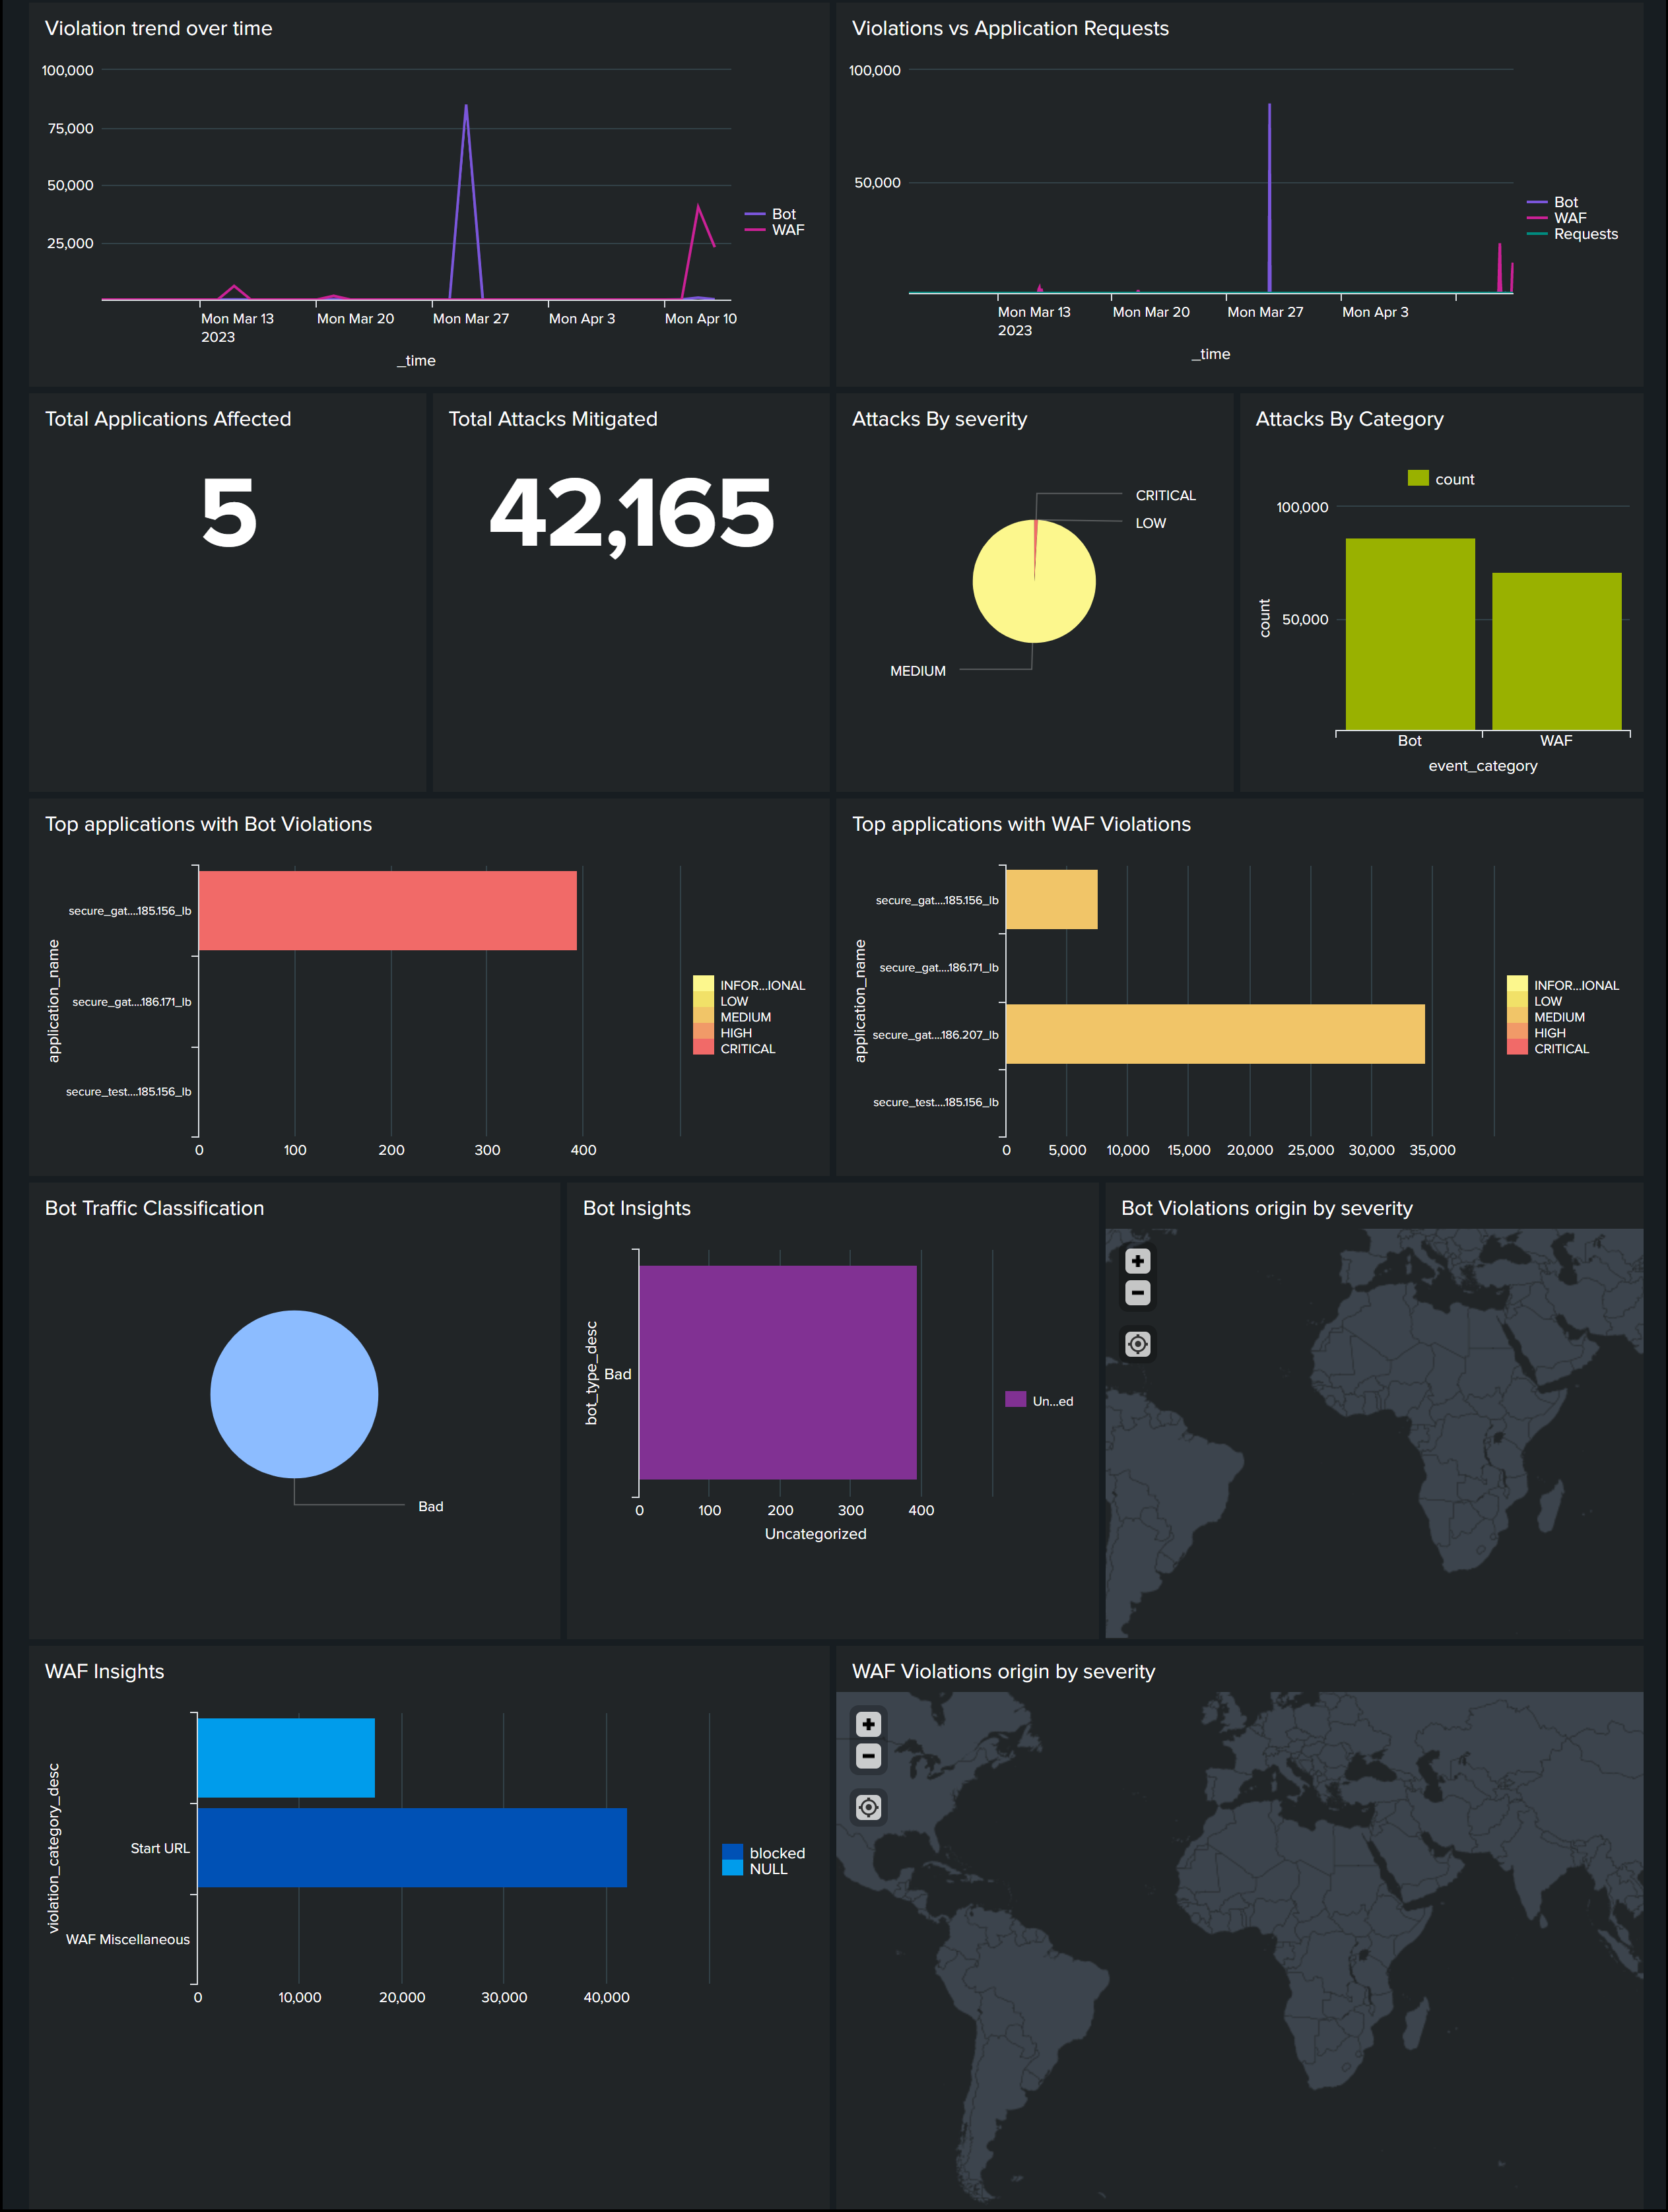
The following is an example for the updated WAF and Bot dashboard:
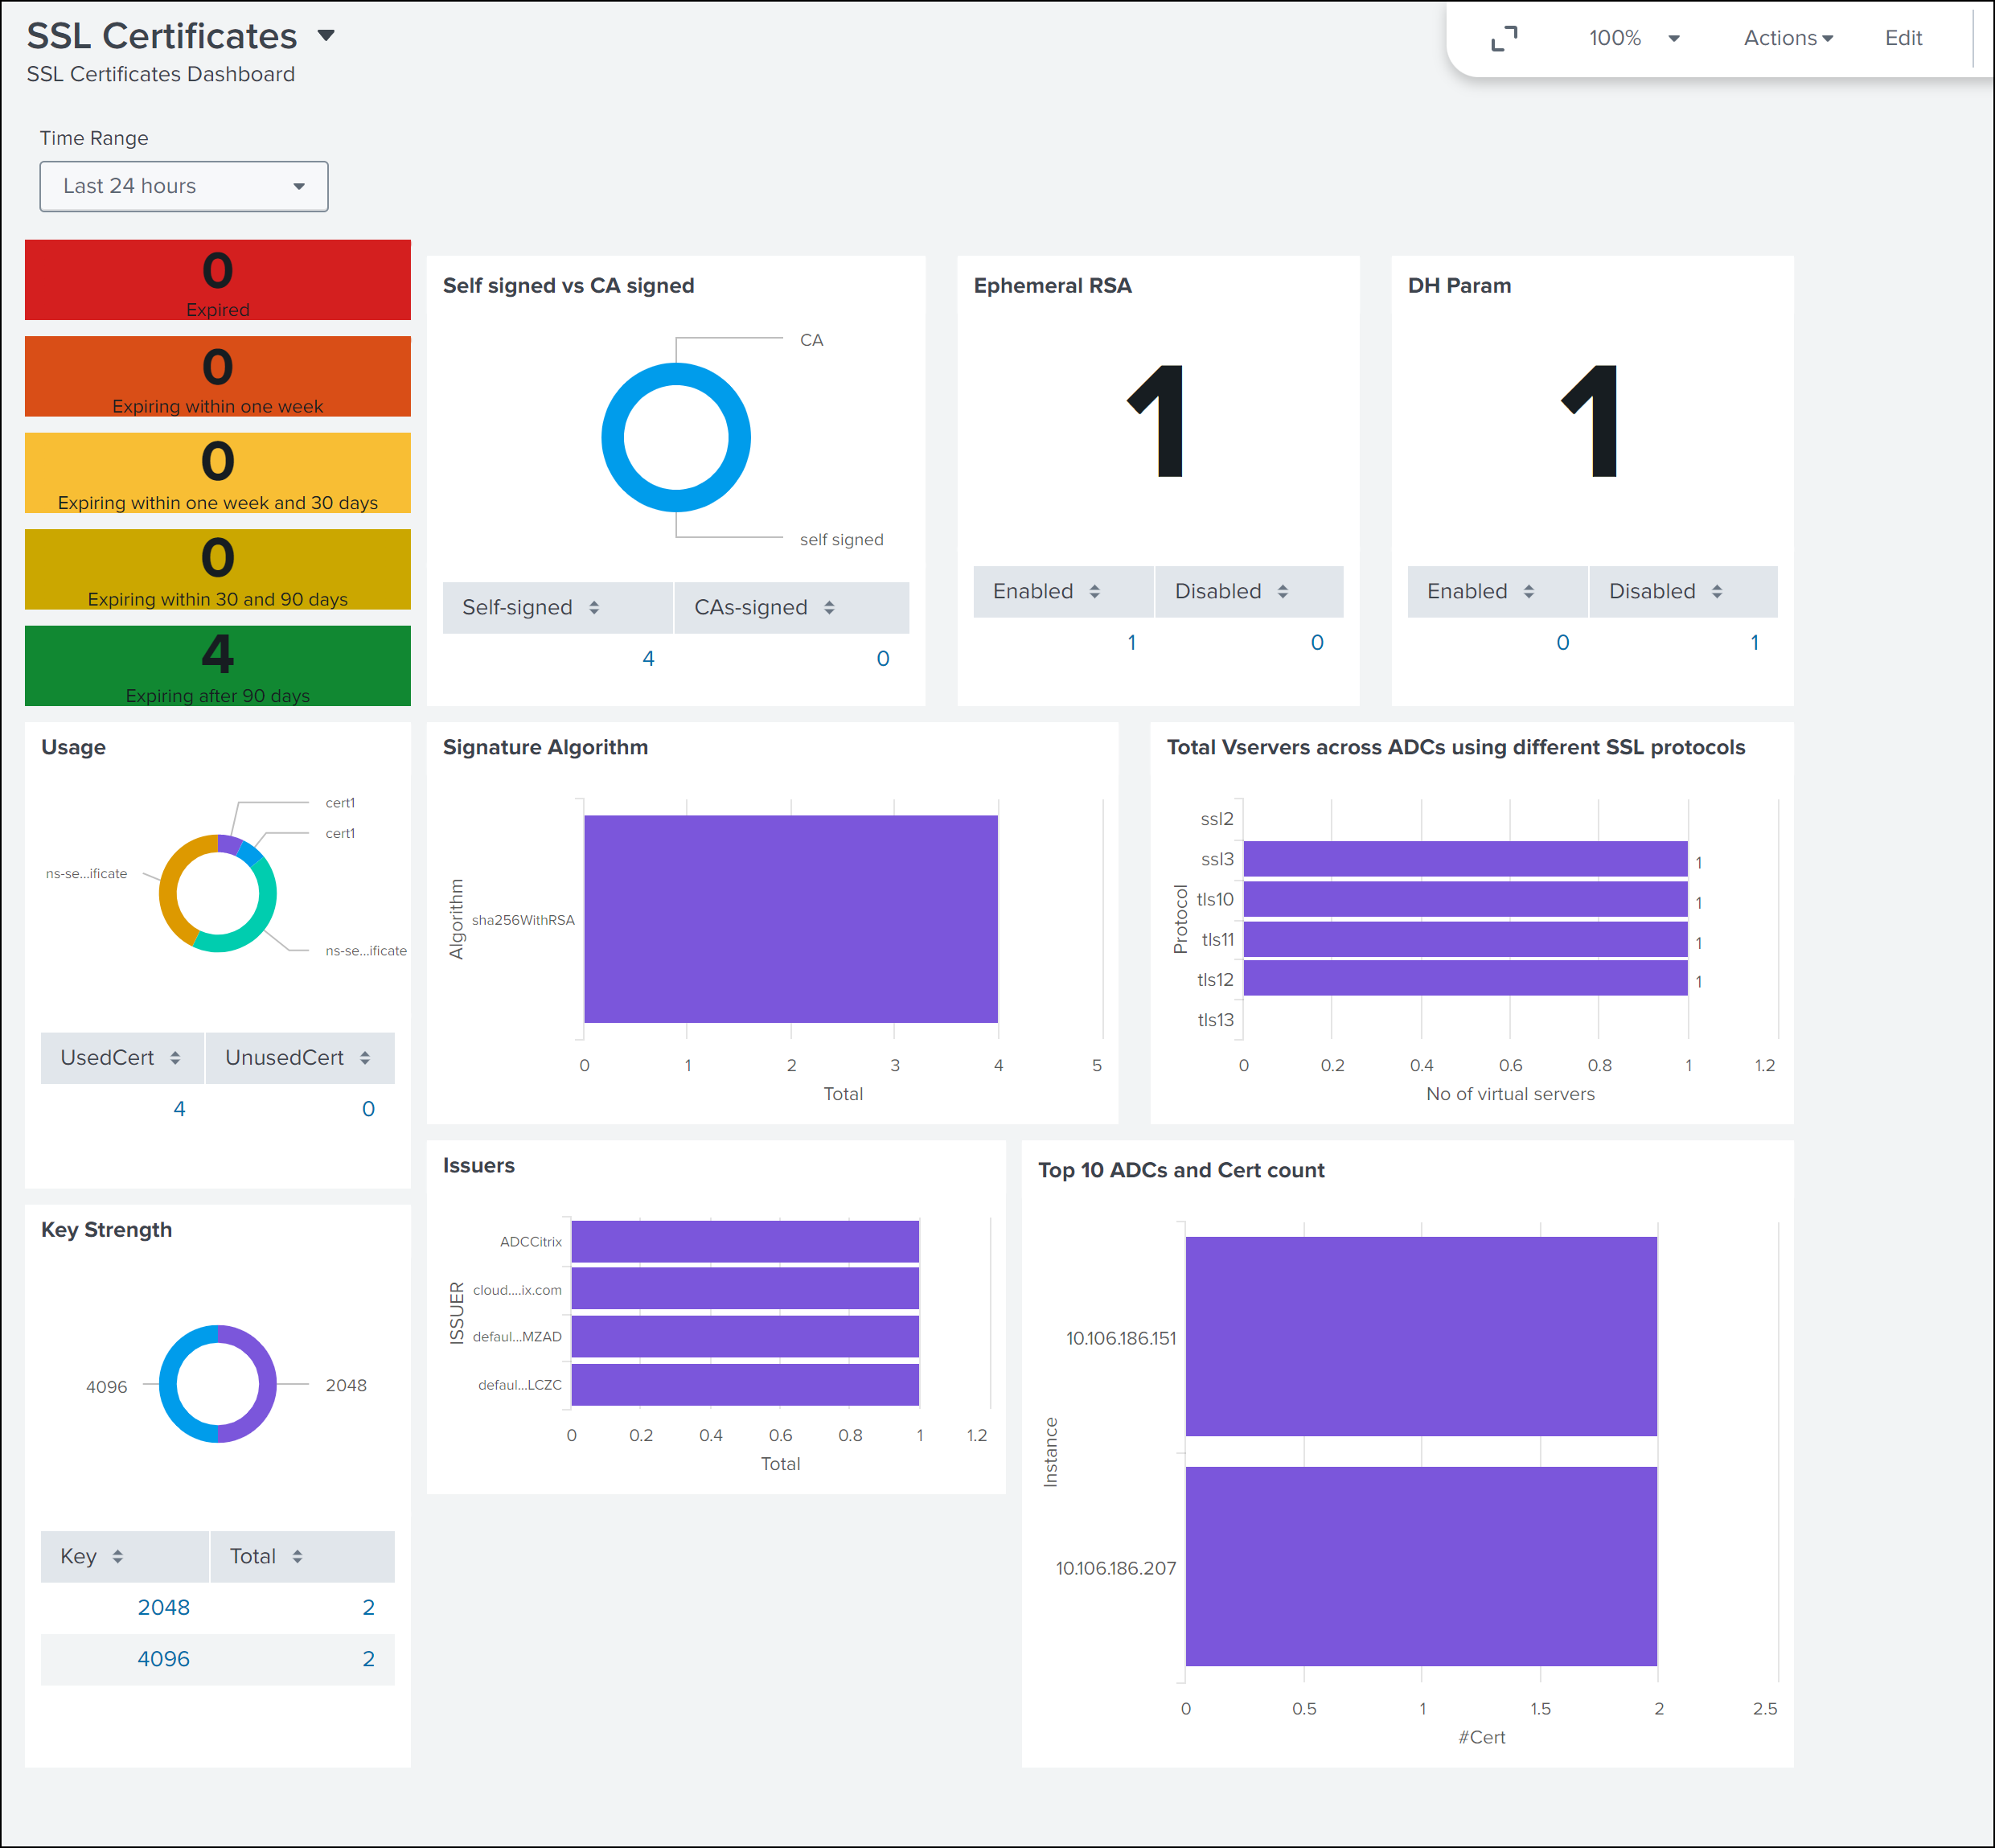
The following dashboard is an example for the updated SSL Certificate insights dashboard.
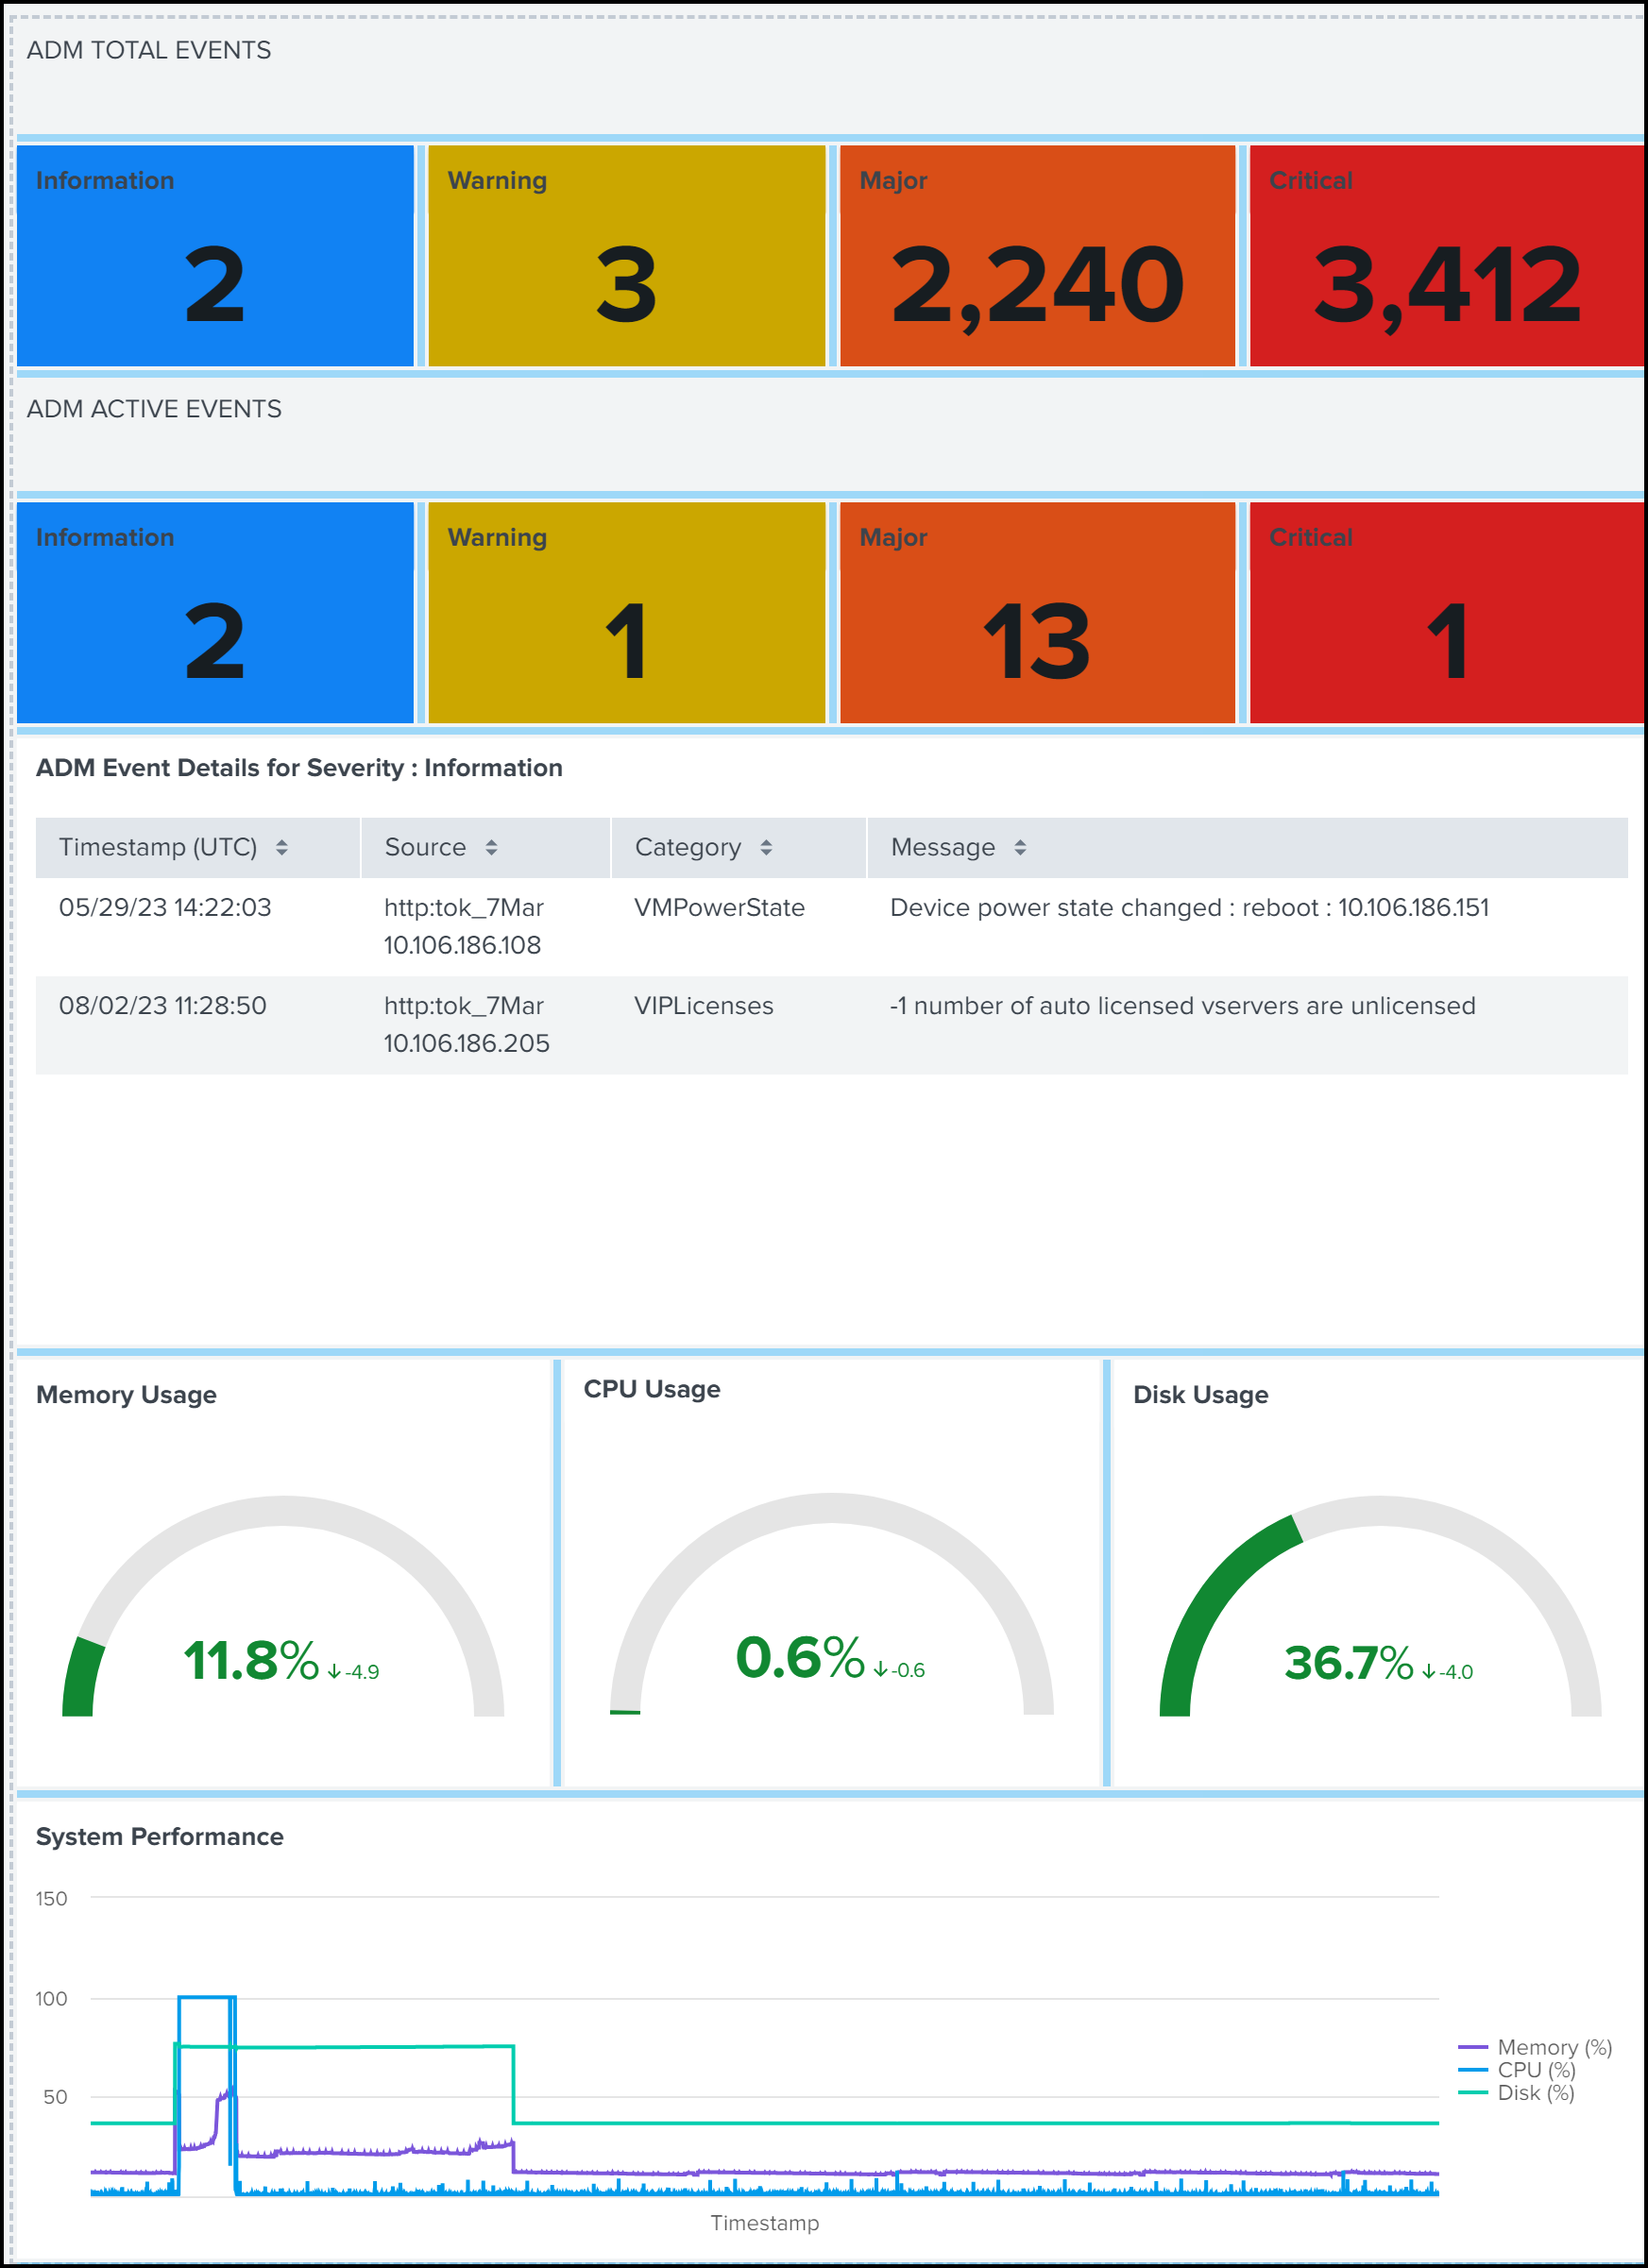
The following dashboard is an example for the updated events and metrics dashboard.
Note:
The usage data for Memory, CPU, and Disk shows the current value from the NetScaler Console. The up and down trend of these values are shown based on the comparison of the previous value for every 5 minutes.
Apart from dashboard, you can also view data in Splunk after creating the subscription.
-
In Splunk, click Search & Reporting.
-
In the search bar:
-
Type
sourcetype="metrics"and select the duration from the list to view the NetScaler Console metrics data. -
Type
sourcetype="event"and select the duration from the list to view the NetScaler Console events data. -
Type
sourcetype="bot"orsourcetype="waf"and select the duration from the list to view bot/WAF data. -
Type
sourcetype="ssl"and select the duration from the list to view the SSL certificate insights data. -
Type
sourcetype="gateway_insights"and select the duration from the list to view the Gateway insights data. -
Type
sourcetype="hdx_insights"and select the duration from the list to view the Gateway insights data. -
Type
sourcetype= "audit_logs"and select the duration from the list to view the audit logs data.
-
Share
Share
This Preview product documentation is Cloud Software Group Confidential.
You agree to hold this documentation confidential pursuant to the terms of your Cloud Software Group Beta/Tech Preview Agreement.
The development, release and timing of any features or functionality described in the Preview documentation remains at our sole discretion and are subject to change without notice or consultation.
The documentation is for informational purposes only and is not a commitment, promise or legal obligation to deliver any material, code or functionality and should not be relied upon in making Cloud Software Group product purchase decisions.
If you do not agree, select I DO NOT AGREE to exit.