-
-
-
-
Scenarios for Flexed or Pooled license expiry and connectivity issues behavior
-
Configure NetScaler Console as the Flexed or Pooled license server
This content has been machine translated dynamically.
Dieser Inhalt ist eine maschinelle Übersetzung, die dynamisch erstellt wurde. (Haftungsausschluss)
Cet article a été traduit automatiquement de manière dynamique. (Clause de non responsabilité)
Este artículo lo ha traducido una máquina de forma dinámica. (Aviso legal)
此内容已经过机器动态翻译。 放弃
このコンテンツは動的に機械翻訳されています。免責事項
이 콘텐츠는 동적으로 기계 번역되었습니다. 책임 부인
Este texto foi traduzido automaticamente. (Aviso legal)
Questo contenuto è stato tradotto dinamicamente con traduzione automatica.(Esclusione di responsabilità))
This article has been machine translated.
Dieser Artikel wurde maschinell übersetzt. (Haftungsausschluss)
Ce article a été traduit automatiquement. (Clause de non responsabilité)
Este artículo ha sido traducido automáticamente. (Aviso legal)
この記事は機械翻訳されています.免責事項
이 기사는 기계 번역되었습니다.책임 부인
Este artigo foi traduzido automaticamente.(Aviso legal)
这篇文章已经过机器翻译.放弃
Questo articolo è stato tradotto automaticamente.(Esclusione di responsabilità))
Translation failed!
Integration with New Relic
You can now integrate NetScaler Console with New Relic to view analytics for WAF, Bot, SSL, Gateway Insights, and NetScaler Console audit logs in your New Relic dashboard. With this integration, you can:
-
Combine all other external data sources in your New Relic dashboard.
-
Get visibility of analytics in a centralized place.
NetScaler Console collects Bot and WAF events, and sends them to New Relic either in real time or periodically based on your choice. As an administrator, you can also view the Bot and WAF events in your New Relic dashboard.
Prerequisites
For a successful integration, you must:
-
Obtain a New Relic event endpoint in the following format:
https://insights-collector.newrelic.com/v1/accounts/<account_id>/eventsFor more information on configuring an event endpoint, see New Relic documentation.
For more information on getting an account ID, see New Relic documentation.
-
Obtain a New Relic key. For more information, see New Relic documentation.
-
Add the key details in NetScaler Console
Add the key details in NetScaler Console
After you generate a token, you must add details in NetScaler Console to integrate with New Relic.
-
Log on to NetScaler Console.
-
Navigate to Settings > Observability Integration.
-
In the Integrations page, click Add.
-
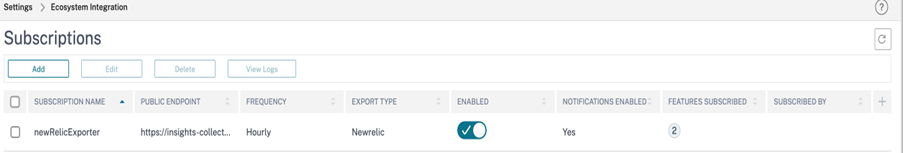
In the Create Subscription page, specify the following details:
-
Specify a name of your choice in the Subscription Name field.
-
Select NetScaler® Console as the Source and click Next.
-
Select New Relic and click Configure. In the Configure Endpoint page:
-
End Point URL – Specify the New Relic end point details. The end point must be in the
https://insights-collector.newrelic.com/v1/accounts/<account_id>/eventsformat.
Note
It is recommended to use HTTPS for security reasons.
-
End Point URL – Specify the New Relic end point details. The end point must be in the
-
Authentication token – Copy and paste the authentication token from New Relic.
- Click Submit.
-
Click Next.
-
Click Add Insights and in the Select Feature tab, you can select the features that you want to export and click Add Selected.
-
Click Next.
-
In the Select Instance tab, you can either choose Select All Instances or Custom select, and then click Next.
-
Select All Instances - Exports data to New Relic from all the NetScaler instances.
-
Custom select - Enables you to select the NetScaler instances from the list. If you select specific instances from the list, then the data is exported to New Relic only from the selected NetScaler instances.
-
-
Click Submit.
Note:
The data for the selected insights gets pushed to New Relic immediately after the violations are detected in NetScaler Console.
-
The configuration is complete. You can view details in the Subscriptions page.
New Relic dashboard
When the events are exported in New Relic, you can view event details under Metrics & events in the following JSON format:
<subsription_name>_adm_<event name> where event name can be Bot, WAF, and so on.
In the following example, ADMSTAGING is the <subscription_name> and bot is the <event_name>.
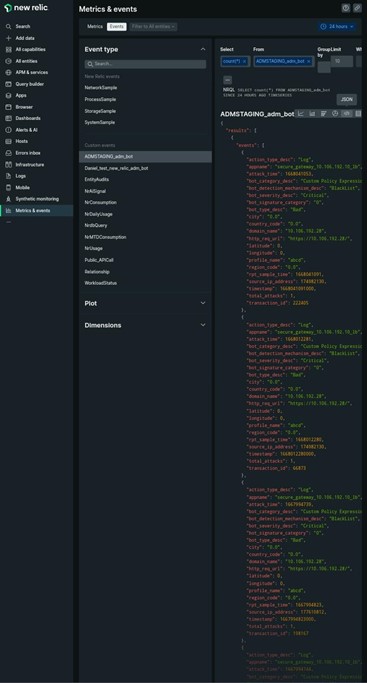
Once you get the JSON data ingested into your New Relic dashboard, as an administrator, you can use the NRQL (New Relic Query Language) and create a custom dashboard with facets and widgets based on your choice by constructing queries around the ingested data. For more information, see https://docs.newrelic.com/docs/query-your-data/nrql-new-relic-query-language/get-started/introduction-nrql-new-relics-query-language/
The following is an example dashboard created using the NRQL:
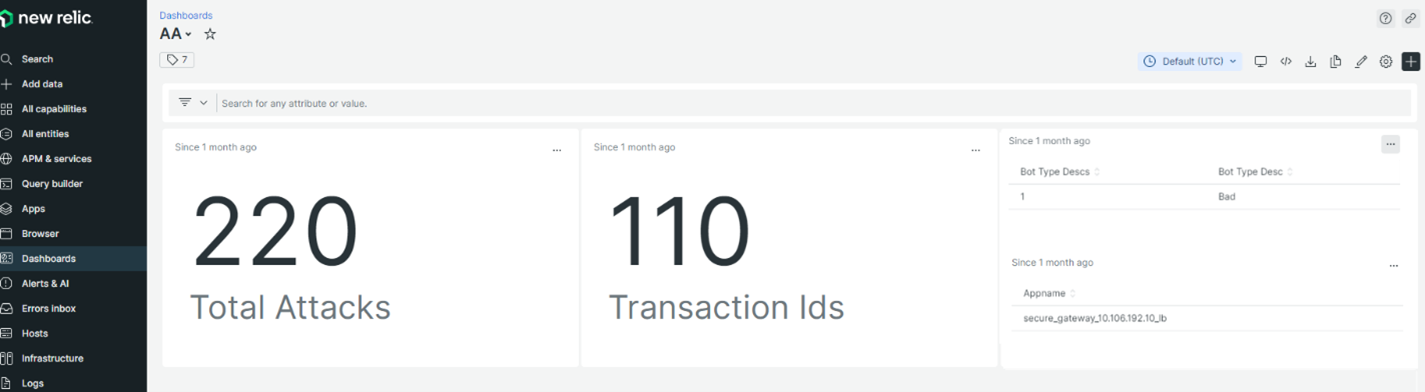
To create this dashboard, the following queries are required:
-
Widget 1: Total Unique Attacks in events table
SELECT count(total_attacks) from <event_name> since 30 days ago -
Widget 2: Unique Transaction IDs in event table
SELECT uniqueCount(transaction_id) from <event_name> since 30 days ago -
Widget 3: Total Unique Bot Types and their counts
SELECT uniqueCount(bot_type_desc), uniques(bot_type_desc) from <event_name> since 30 days ago -
Widget 4: Total unique App Names seeing Bot Violations
SELECT uniques(appname) from <event_name> since 30 days ago
Share
Share
In this article
This Preview product documentation is Cloud Software Group Confidential.
You agree to hold this documentation confidential pursuant to the terms of your Cloud Software Group Beta/Tech Preview Agreement.
The development, release and timing of any features or functionality described in the Preview documentation remains at our sole discretion and are subject to change without notice or consultation.
The documentation is for informational purposes only and is not a commitment, promise or legal obligation to deliver any material, code or functionality and should not be relied upon in making Cloud Software Group product purchase decisions.
If you do not agree, select I DO NOT AGREE to exit.