-
-
-
-
View instance details in Infrastructure Analytics
-
-
-
-
Scenarios for Flexed or Pooled license expiry and connectivity issues behavior
-
Configure NetScaler Console as the Flexed or Pooled license server
This content has been machine translated dynamically.
Dieser Inhalt ist eine maschinelle Übersetzung, die dynamisch erstellt wurde. (Haftungsausschluss)
Cet article a été traduit automatiquement de manière dynamique. (Clause de non responsabilité)
Este artículo lo ha traducido una máquina de forma dinámica. (Aviso legal)
此内容已经过机器动态翻译。 放弃
このコンテンツは動的に機械翻訳されています。免責事項
이 콘텐츠는 동적으로 기계 번역되었습니다. 책임 부인
Este texto foi traduzido automaticamente. (Aviso legal)
Questo contenuto è stato tradotto dinamicamente con traduzione automatica.(Esclusione di responsabilità))
This article has been machine translated.
Dieser Artikel wurde maschinell übersetzt. (Haftungsausschluss)
Ce article a été traduit automatiquement. (Clause de non responsabilité)
Este artículo ha sido traducido automáticamente. (Aviso legal)
この記事は機械翻訳されています.免責事項
이 기사는 기계 번역되었습니다.책임 부인
Este artigo foi traduzido automaticamente.(Aviso legal)
这篇文章已经过机器翻译.放弃
Questo articolo è stato tradotto automaticamente.(Esclusione di responsabilità))
Translation failed!
View instance details in Infrastructure Analytics
-
Navigate to Infrastructure > Infrastructure Analytics
-
Click the circle pack view and select the IP address.
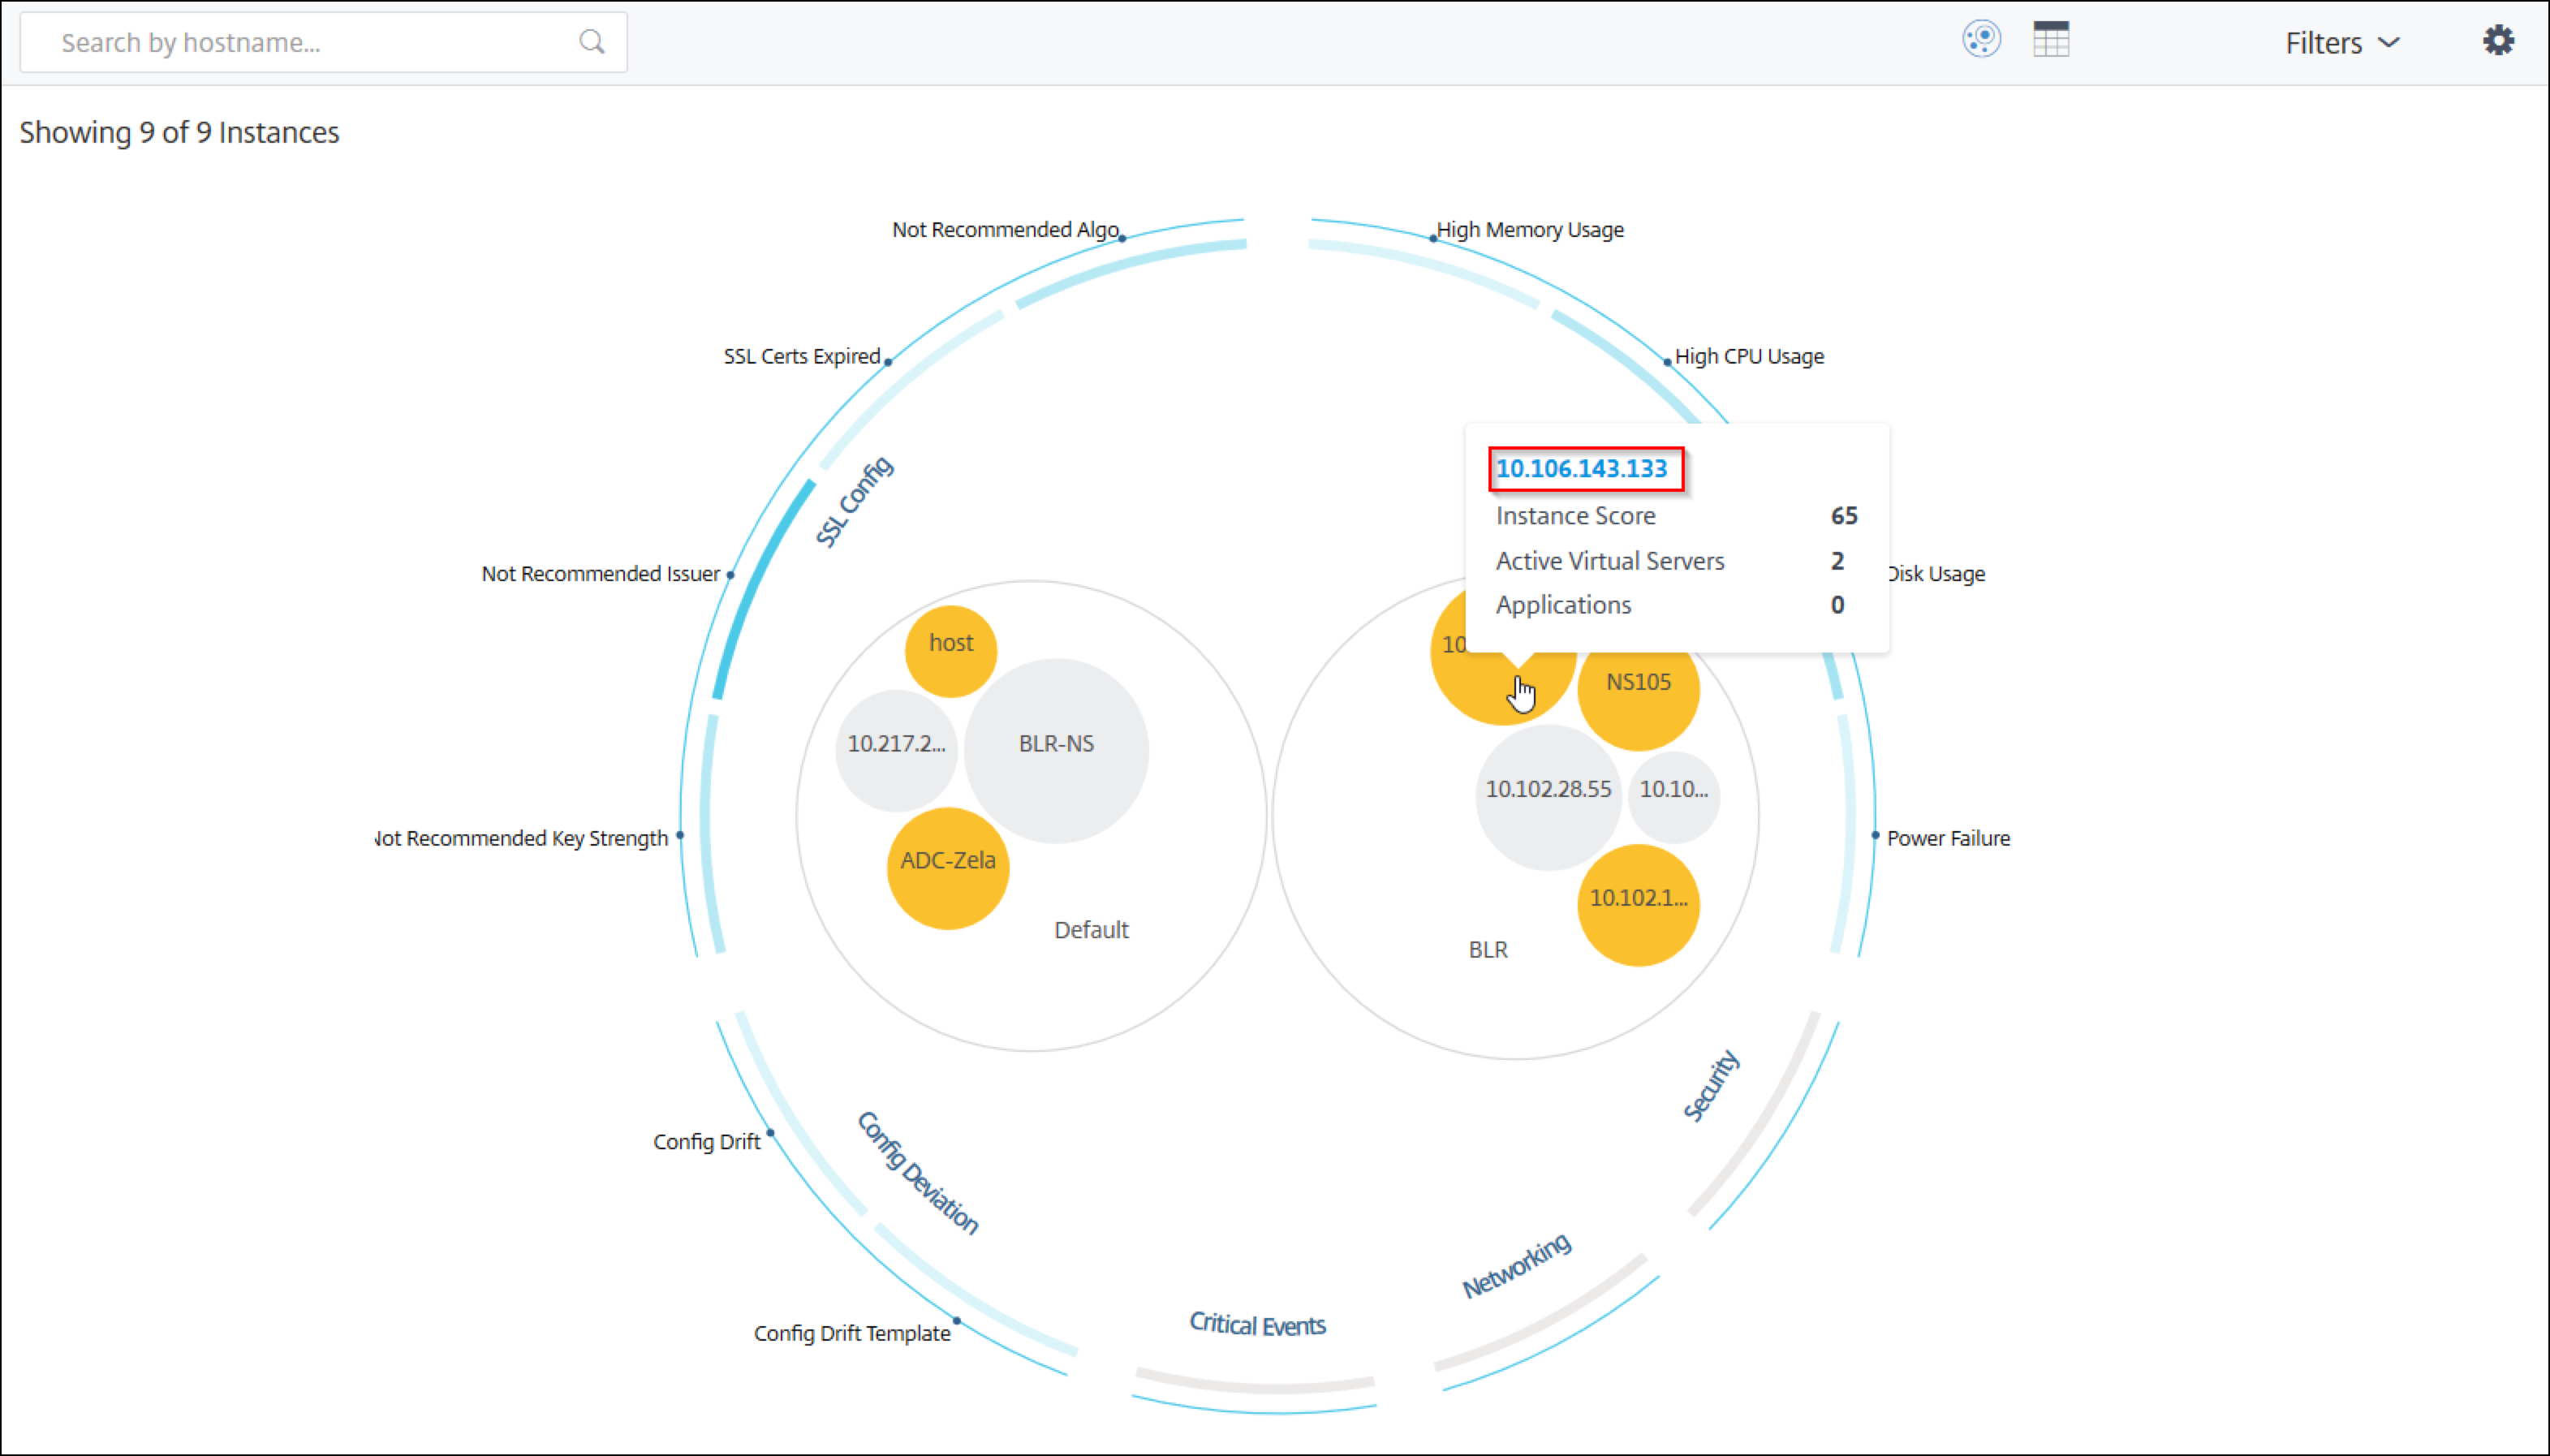
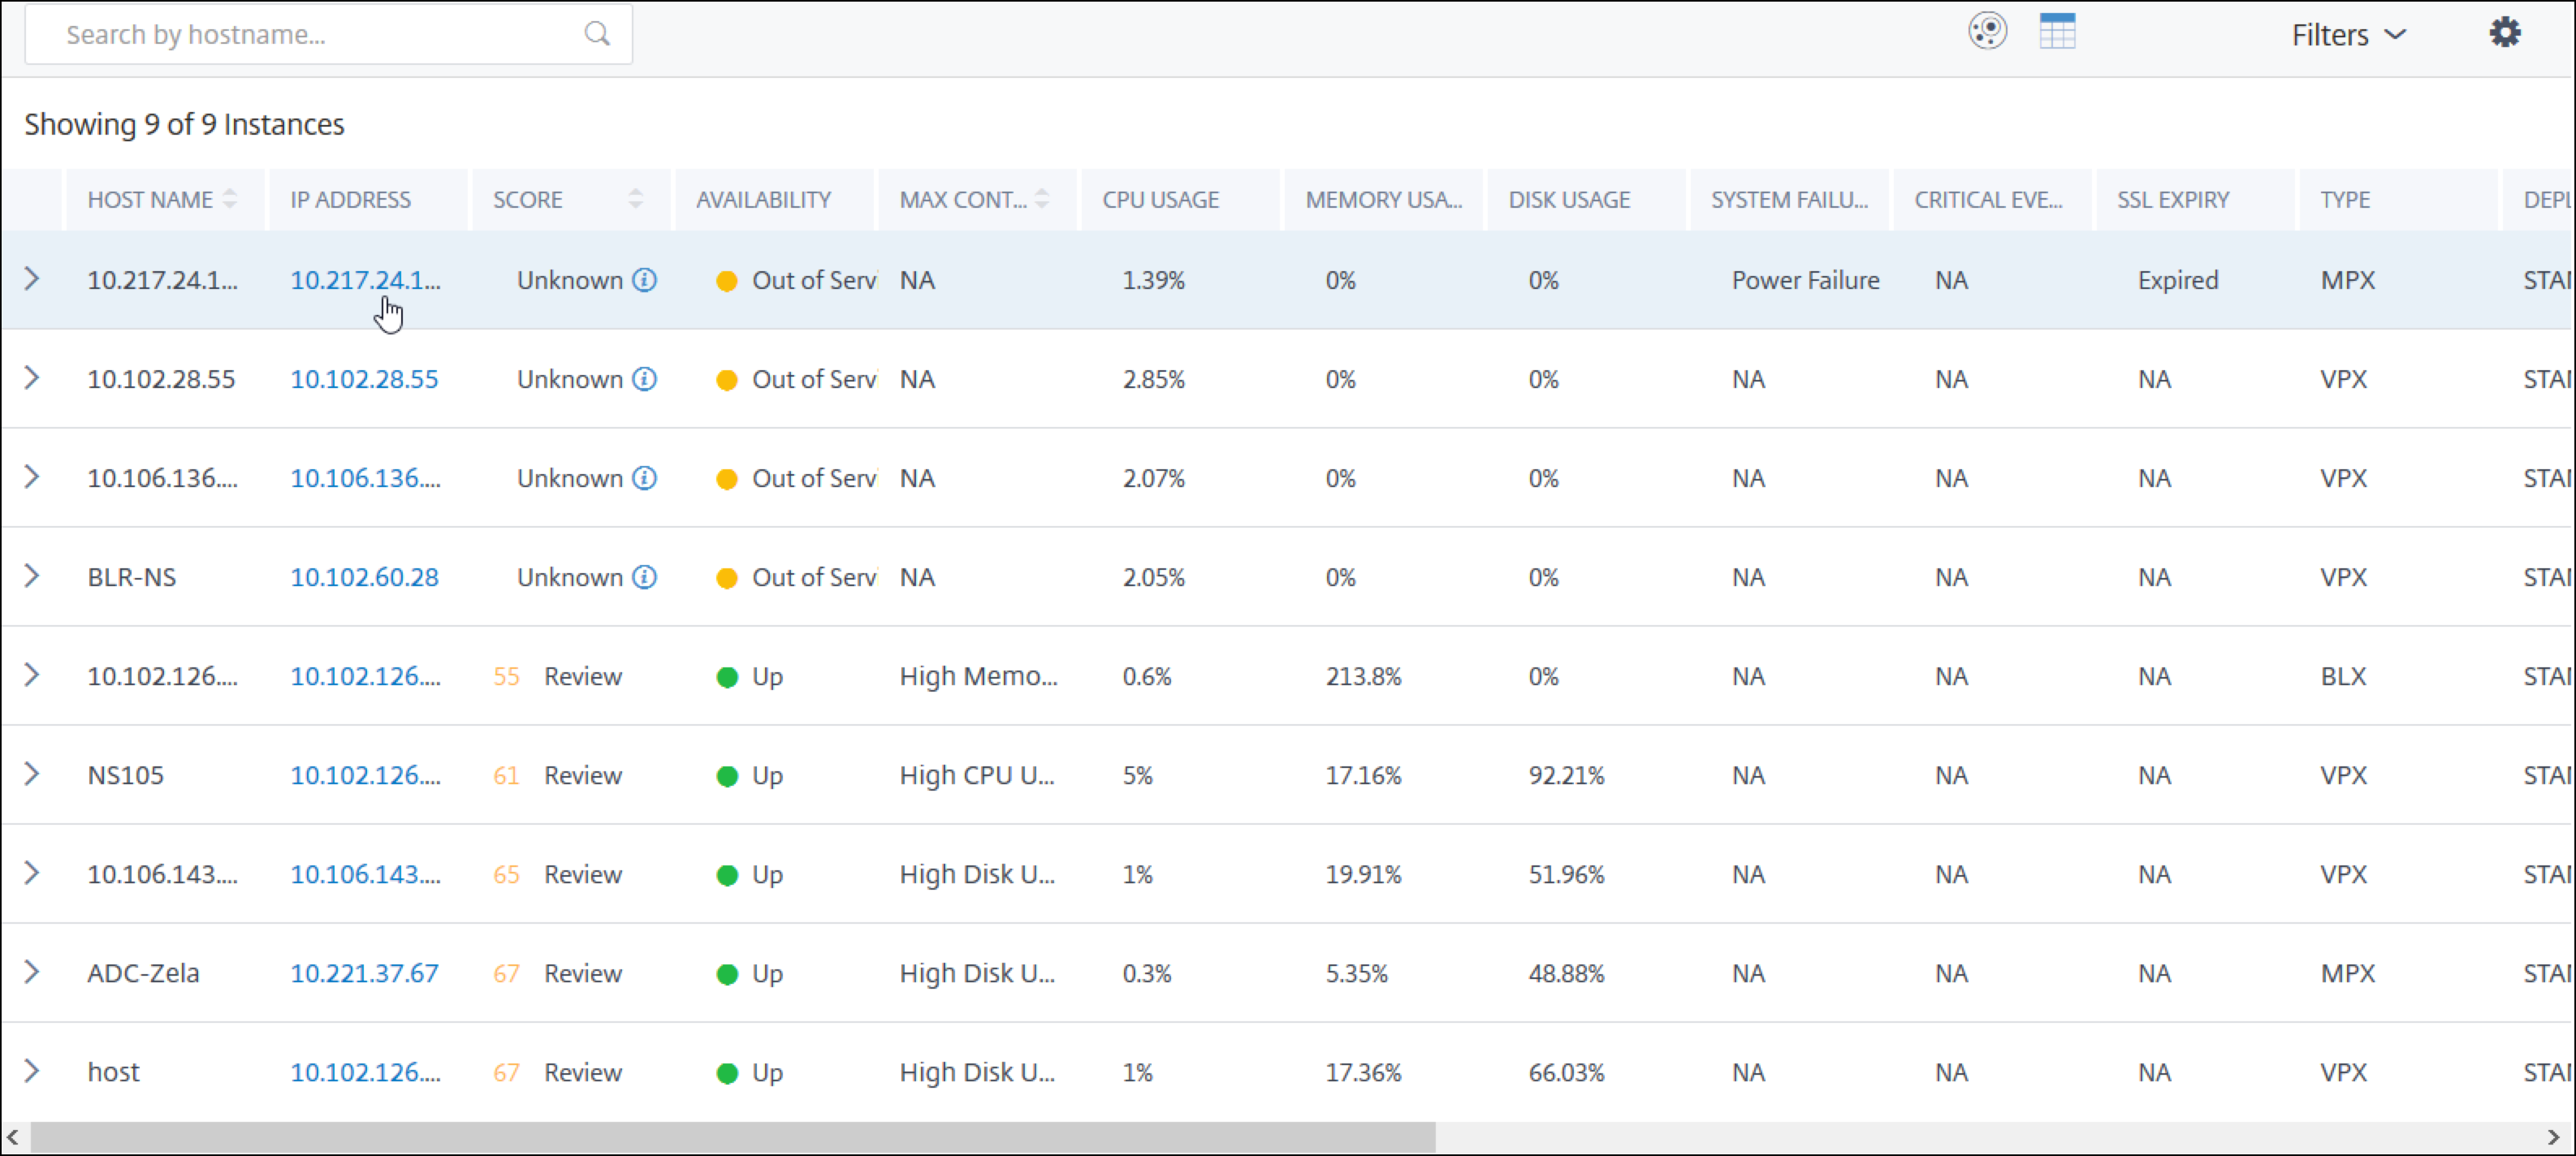
You can also click an IP address from the table view.
-
Host name – Denotes the host name assigned to the NetScaler instance
-
IP address – Denotes the IP address of the NetScaler instance
-
Score – Denotes the NetScaler instance score and the status such as Critical, Good, and Fair
-
Availability – Denotes the status of the NetScaler instance such as Up, Down, or Out of service.
-
Max Contribution – Denotes the issue category that the NetScaler instance has the maximum error counts.
-
CPU usage – Denotes the current CPU % used by the instance
-
Memory usage – Denotes the current memory % used by the instance
-
Disk usage – Denotes the current disk % used by the instance
-
System Failure – Denotes the total number of errors for the instance system
-
Critical Events – Denotes the event category that the NetScaler instance has the maximum events
-
SSL expiry – Denotes the status of the SSL certificate installed on the NetScaler instance
-
Type – Denotes the NetScaler instance type such as VPX, SDX, MPX, or CPX
-
Deployment – Denotes if the NetScaler instance is deployed as a standalone instance or HA pair
-
Model – Denotes the NetScaler instance model number
-
Version – Denotes the NetScaler instance version and build number
-
Throughput – Denotes the current network throughput from the NetScaler instance
-
HTTPS request/sec – Denotes the current HTTPS requests/sec received by the NetScaler instance
-
TCP connection – Denotes the current TCP connections established
-
SSL transaction – Denotes the current SSL transactions processed by the NetScaler instance
-
Site – Denotes the name of the site that the NetScaler instance is deployed.
Note
For every 5 minutes, the current values for CPU usage, memory usage, disk usage, throughput, and so on are updated.
Click Instance Details to view the details.

The following details are displayed:
-
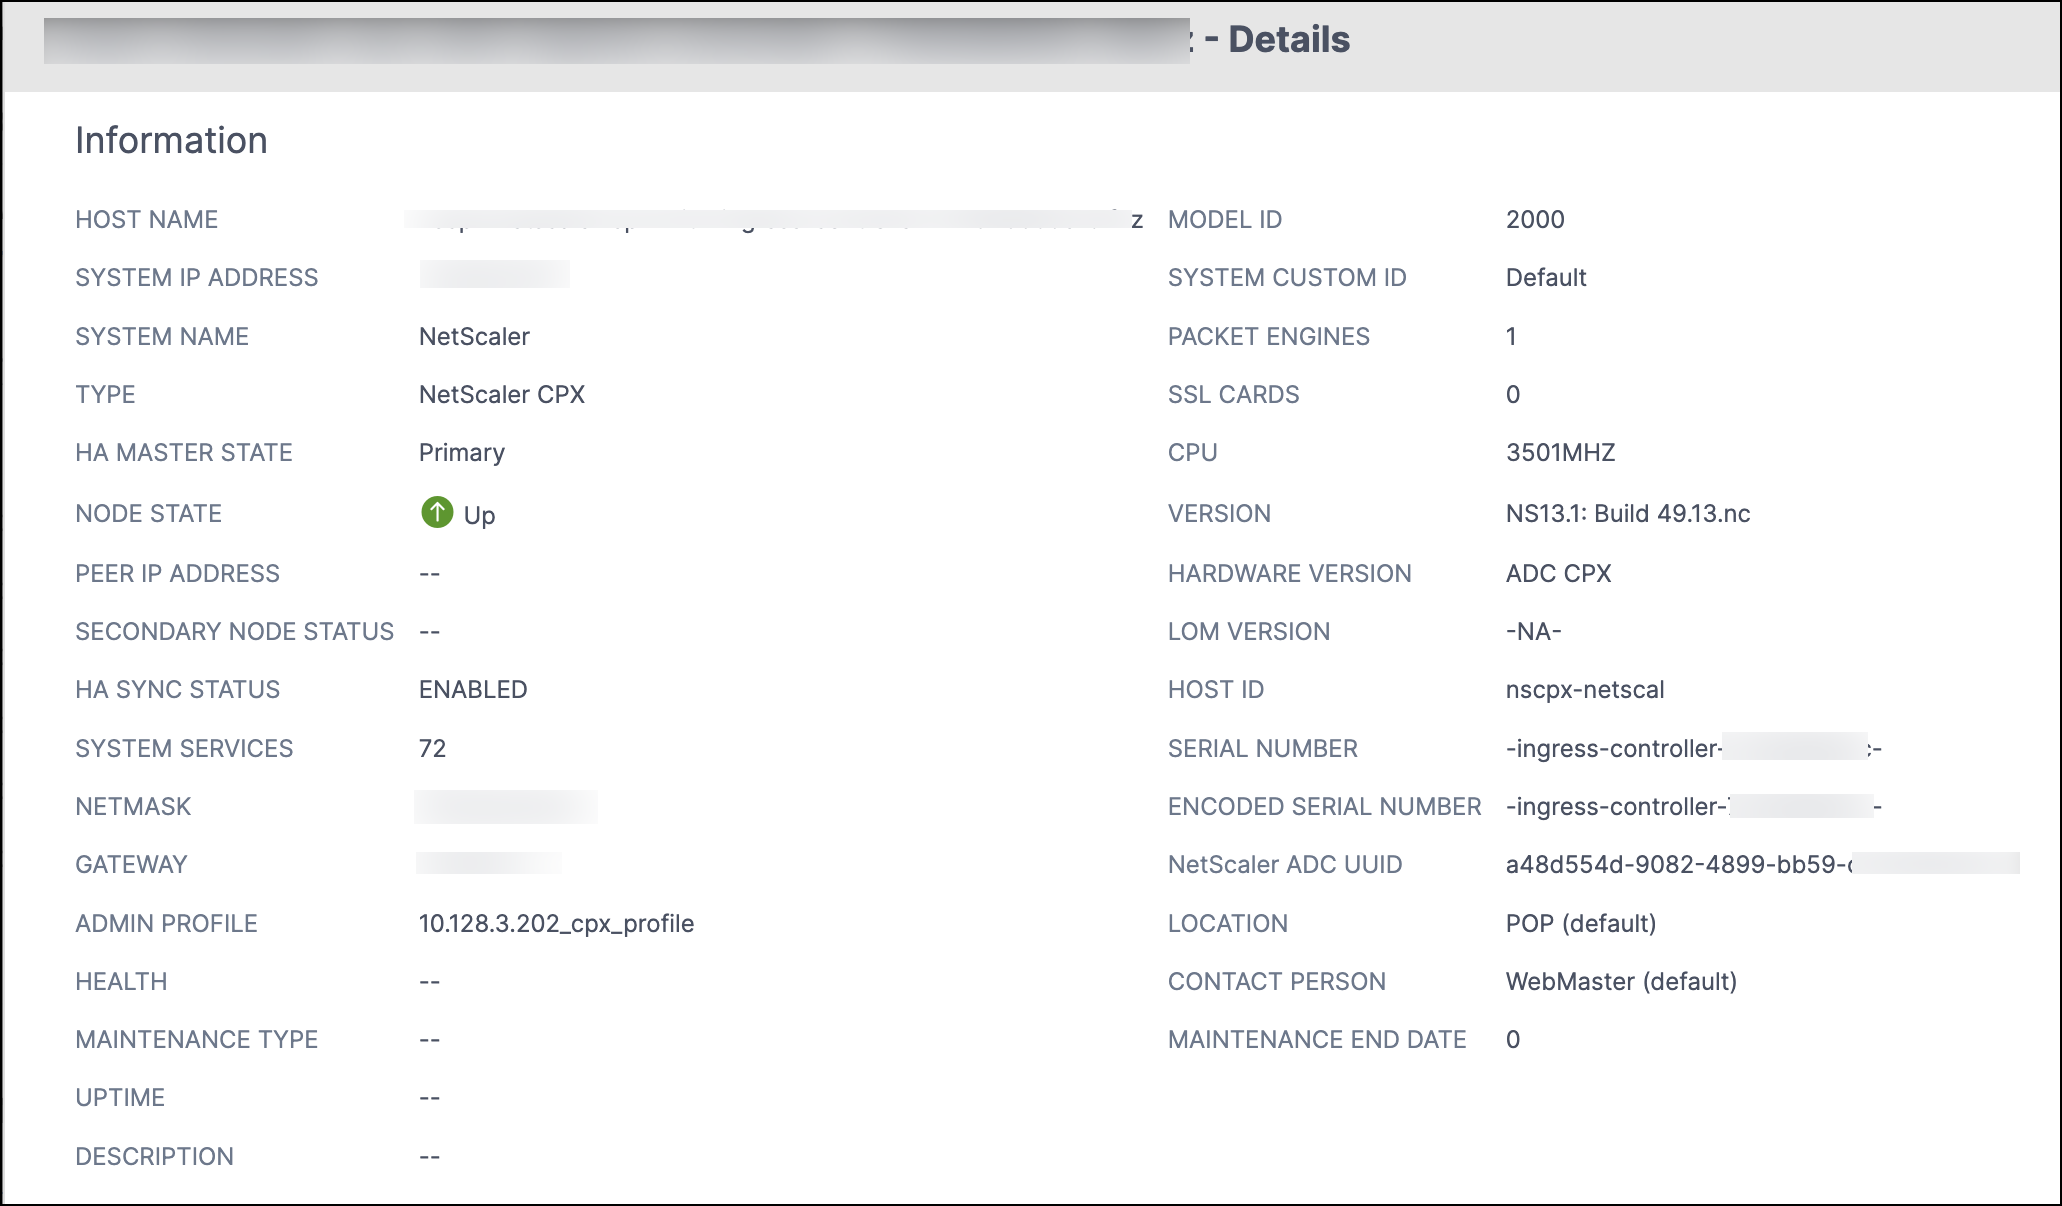
Information - Instance details such as instance type, deployment type, version, model.
-
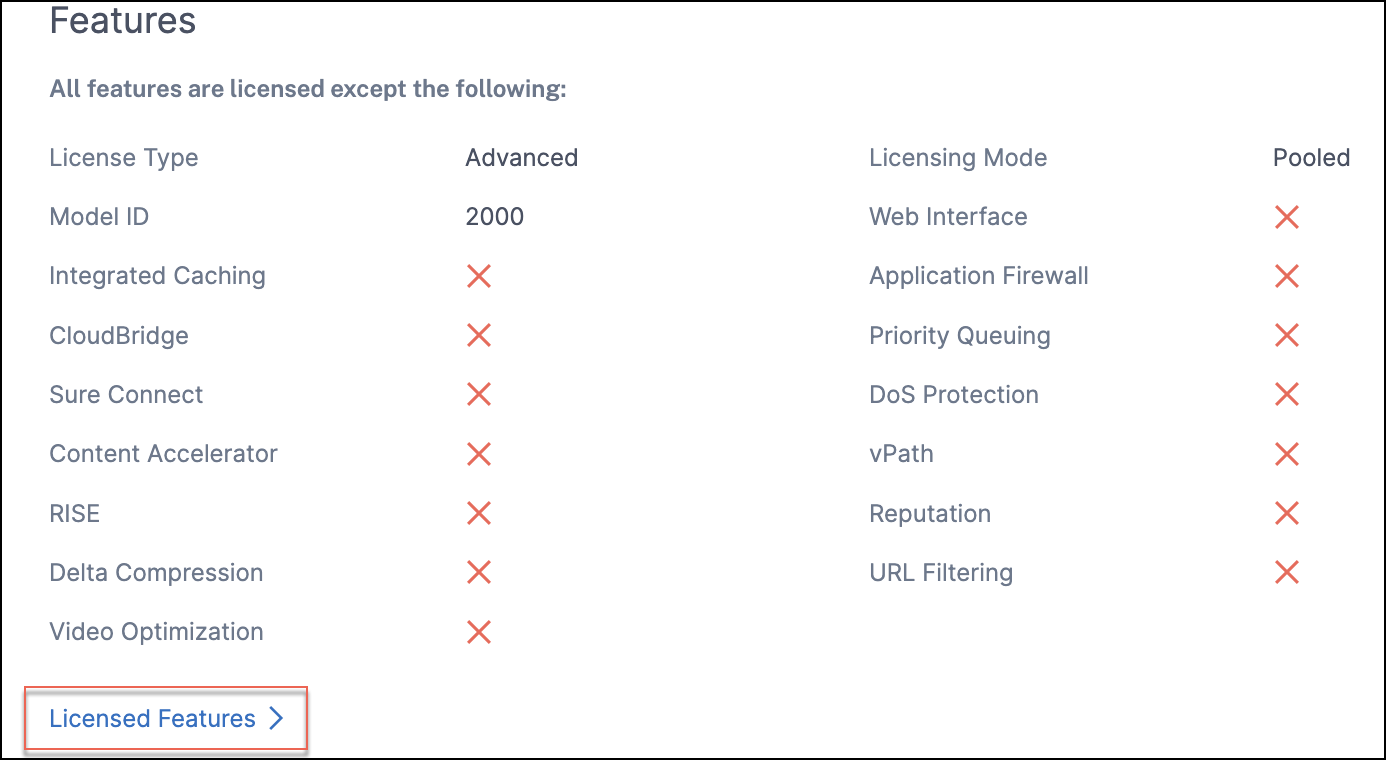
Features – By default, the features that are not licensed are displayed. Click Licensed Features to view the features that are licensed.
-
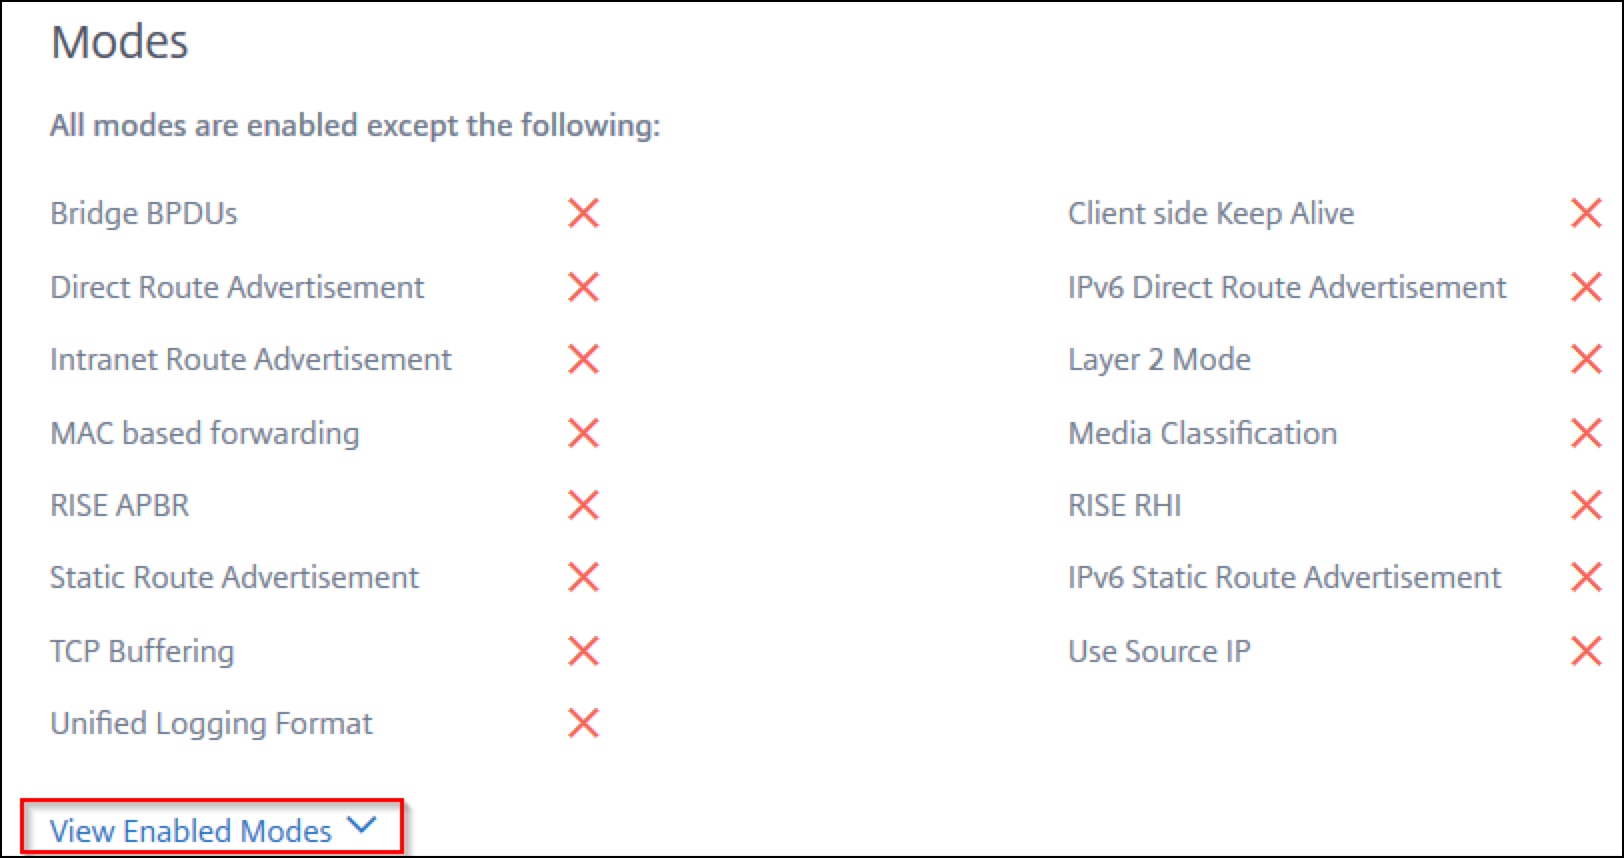
Modes – By default, all modes that are disabled on the instance are displayed. Click View Enabled Modes to view the enabled modes on the instance.
The instance dashboard presents an instance overview where you can see the following details:
-
Instance score

1 – Indicates the current NetScaler instance score for the selected time duration. The final score is calculated as 100 minus total penalties. The graph displays the score ranges for the selected time duration.
2 – Indicates the status of the NetScaler instance, such as Up, Down, and Out of Service.
3 – Indicates the duration that the NetScaler instance is up and running.
4 – Indicates the total network interfaces enabled and disabled for the instance. Click to view the details such as network interface name and the status (enabled or disabled).
5 – Select the time duration from the list to view the instance details.
6 – Displays the total issues and issue category of the NetScaler instance.
-
Key Metrics
Click each tab to view the details. In each metric, you can view the average value and the difference value for the selected time.
The following image is an example for HTTPS Req/Sec and the selected time duration is 1 hour. The value 692 is the average HTTPS Req/Sec for the 1-month duration and the value 20 is the difference value. In the graph, the first value is 139 and the last value is 119. The difference value is 139 – 119 = 20.

You can view the following instance metrics in a graph format for the selected time duration:
-
CPU Usage – The average CPU % from the instance for the selected duration (displays for both packet CPU and for management CPU).
-
Memory Usage – The average memory usage % from the instance for the selected duration.
-
Disk Usage – The average disk space % from the instance for the selected duration.
-
Throughput – The average network throughput processed by the instance for the selected duration.
-
HTTPS request/sec – The average HTTPs requests received by the instance for the selected duration.
-
TCP connections – The average TCP connections established by the client and server for the selected duration.
-
SSL transactions – The average SSL transactions processed by the instance for the selected duration.
-
-
Issues
You can view the following issues that occur in NetScaler instance:
Issue Category Description Issues System Resources Displays all issues related to the NetScaler system resource such as CPU, Memory, disk usage. - High CPU Usage
- High Memory Usage
- High Disk Usage
- SSL Card Failures
- Power Failure
- Disk Error
- Flash Error
- NIC Discards
SSL Config Displays all issues related to the SSL configuration on the NetScaler instance. - SSL Certs Expired
- Not Recommended Issuer
- Not Recommended Algorithm
- Not Recommended Key Strength
Config Deviation Displays all issues related to the configuration jobs applied in NetScaler instance. - Config Drift
- Running vs Template
Critical events Displays all critical events related to NetScaler instances configured in HA pair and in Cluster. - Cluster Prop Failure
- Cluster Sync Failure
- Cluster versions Mismatch
- HA Bad Secondary State
- HA No Heat Beats
- HA Sync Failure
- HA Version Mismatch
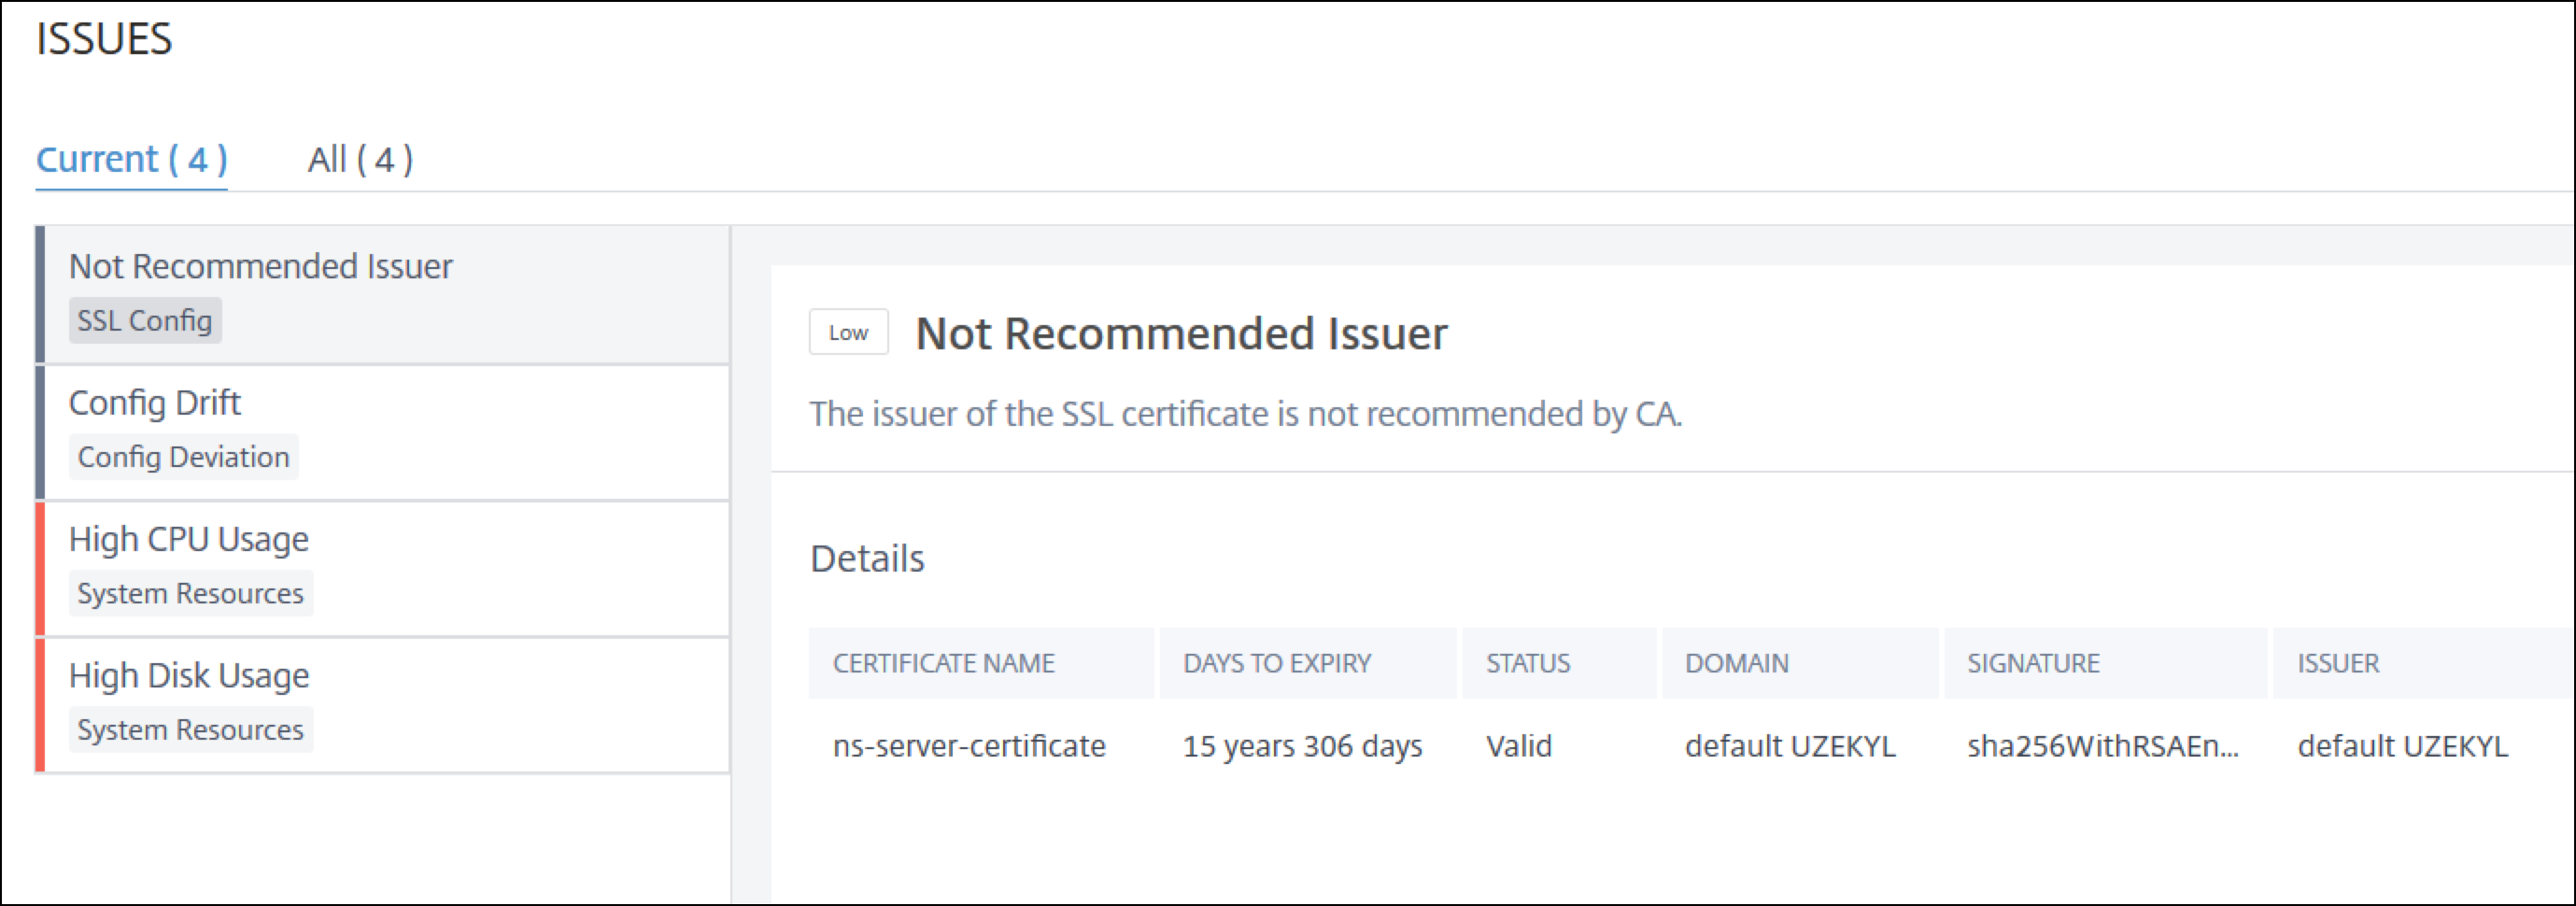
Networking Displays the operational issues that occur in the instances. For more information, see Enhanced Infrastructure Analytics with new indicators. Click each tab to analyze and troubleshoot the issue. For example, consider that an instance has the following errors for the selected time duration:
-
The Current tab displays the issues that are currently affecting the instance score.
-
The All tab displays all infra issues detected for the selected duration.
Share
Share
In this article
This Preview product documentation is Cloud Software Group Confidential.
You agree to hold this documentation confidential pursuant to the terms of your Cloud Software Group Beta/Tech Preview Agreement.
The development, release and timing of any features or functionality described in the Preview documentation remains at our sole discretion and are subject to change without notice or consultation.
The documentation is for informational purposes only and is not a commitment, promise or legal obligation to deliver any material, code or functionality and should not be relied upon in making Cloud Software Group product purchase decisions.
If you do not agree, select I DO NOT AGREE to exit.