This content has been machine translated dynamically.
Dieser Inhalt ist eine maschinelle Übersetzung, die dynamisch erstellt wurde. (Haftungsausschluss)
Cet article a été traduit automatiquement de manière dynamique. (Clause de non responsabilité)
Este artículo lo ha traducido una máquina de forma dinámica. (Aviso legal)
此内容已经过机器动态翻译。 放弃
このコンテンツは動的に機械翻訳されています。免責事項
이 콘텐츠는 동적으로 기계 번역되었습니다. 책임 부인
Este texto foi traduzido automaticamente. (Aviso legal)
Questo contenuto è stato tradotto dinamicamente con traduzione automatica.(Esclusione di responsabilità))
This article has been machine translated.
Dieser Artikel wurde maschinell übersetzt. (Haftungsausschluss)
Ce article a été traduit automatiquement. (Clause de non responsabilité)
Este artículo ha sido traducido automáticamente. (Aviso legal)
この記事は機械翻訳されています.免責事項
이 기사는 기계 번역되었습니다.책임 부인
Este artigo foi traduzido automaticamente.(Aviso legal)
这篇文章已经过机器翻译.放弃
Questo articolo è stato tradotto automaticamente.(Esclusione di responsabilità))
Translation failed!
NetScaler® メトリクスと監査ログの Splunk へのエクスポート設定
NetScalerは、メトリクスをJSON形式でSplunkに直接エクスポートすることをサポートしています。NetScalerは、アプリケーションの健全性とアプリケーションセキュリティの健全性を監視するための豊富なメトリクスを提供します。NetScalerが提供するメトリクスをSplunkにエクスポートすることで、メトリクスを視覚化し、有意義な洞察を得ることができます。
監査ロギングにより、NetScalerのさまざまなモジュールによって収集されたNetScalerの状態およびステータス情報をログに記録できます。ログを確認することで、問題やエラーをトラブルシューティングし、修正できます。
詳細については、以下を参照してください。
NetScaler Consoleを介してメトリクスと監査ログのSplunkへのエクスポートを設定するには、次の手順を実行します。
-
[設定] > [可観測性統合] の順に移動します。
-
[統合] ページで、[追加] をクリックします。
-
[サブスクリプションの作成] ページで、次の詳細を指定します。
-
[サブスクリプション名] フィールドに任意の名前を指定します。
-
[ソース] として [NetScaler] を選択し、[次へ] をクリックします。
-
[宛先] として [Splunk] を選択し、[設定] をクリックします。[エンドポイントの設定] で、次の手順を実行します。
-
エンドポイント URL - Splunkエンドポイントの詳細を指定します。エンドポイントは
https://SPLUNK_PUBLIC_IP:SPLUNK_HEC_PORT/services/collector/eventの形式である必要があります。 -
認証トークン - Splunkから認証トークンをコピーして貼り付けます。
-
[送信] をクリックします。
-
-
[次へ] をクリックします。
-
[インサイトの追加] をクリックし、[NetScalerメトリクス] と [NetScaler監査ログ] を選択してから、[選択を追加] をクリックします。
-
[次へ] をクリックします。
-
[インスタンスの追加] をクリックし、インスタンスを選択します。
-
[送信] をクリックします。
-
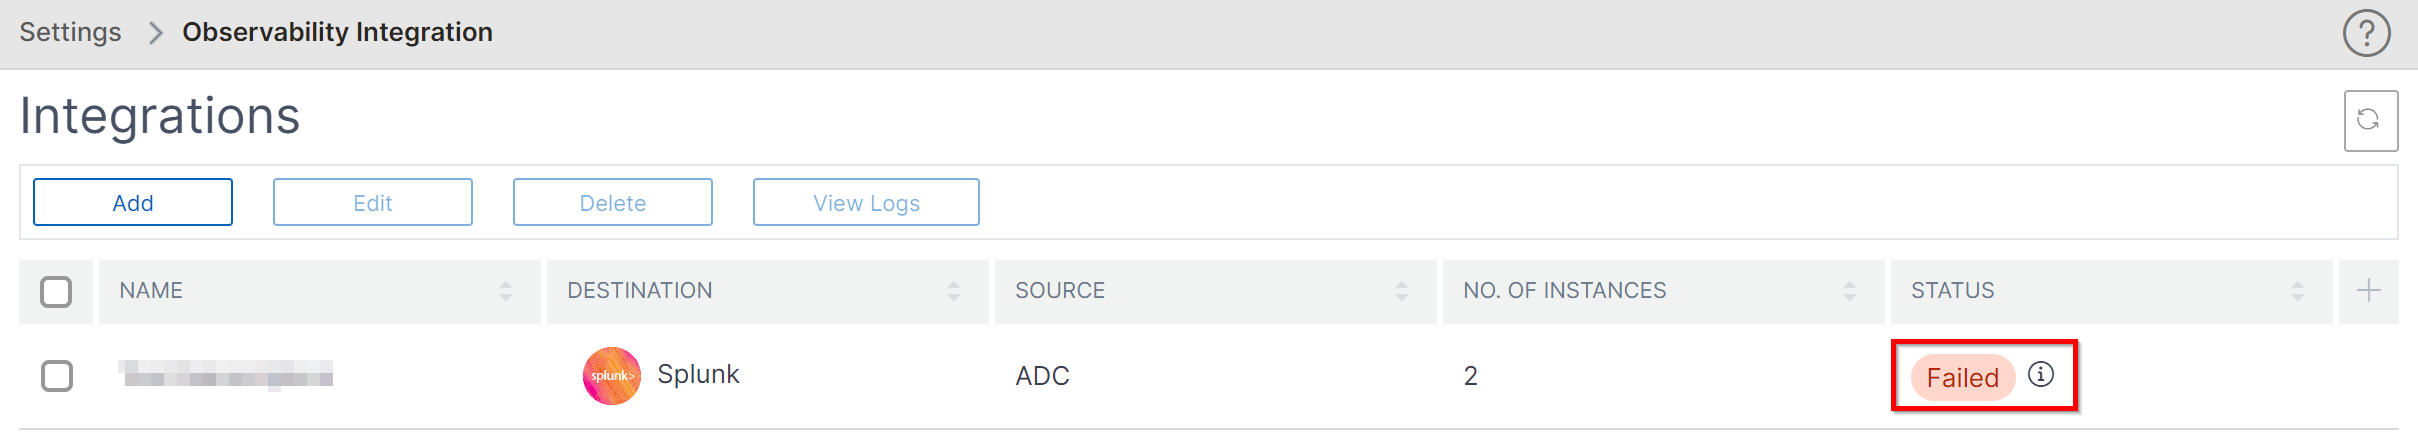
失敗した構成のログ表示
サブスクリプションを作成した後、[設定] > [可観測性統合] で作成されたサブスクリプションのステータスを表示できます。ステータスが [失敗] と表示されている場合は、クリックして詳細を表示します。
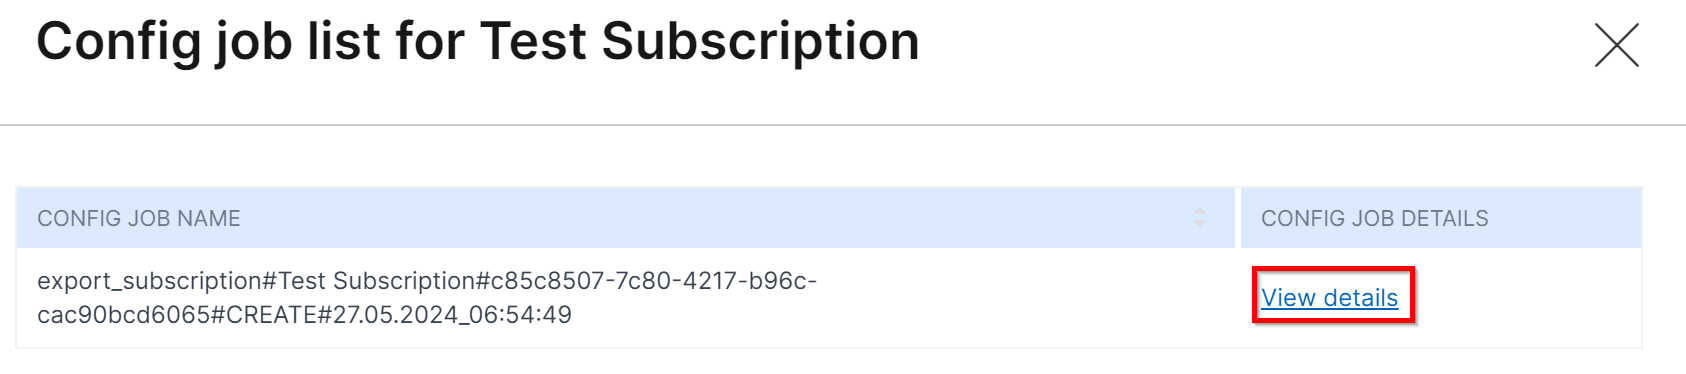
[構成ジョブの詳細] の下の [詳細を表示] をクリックします。
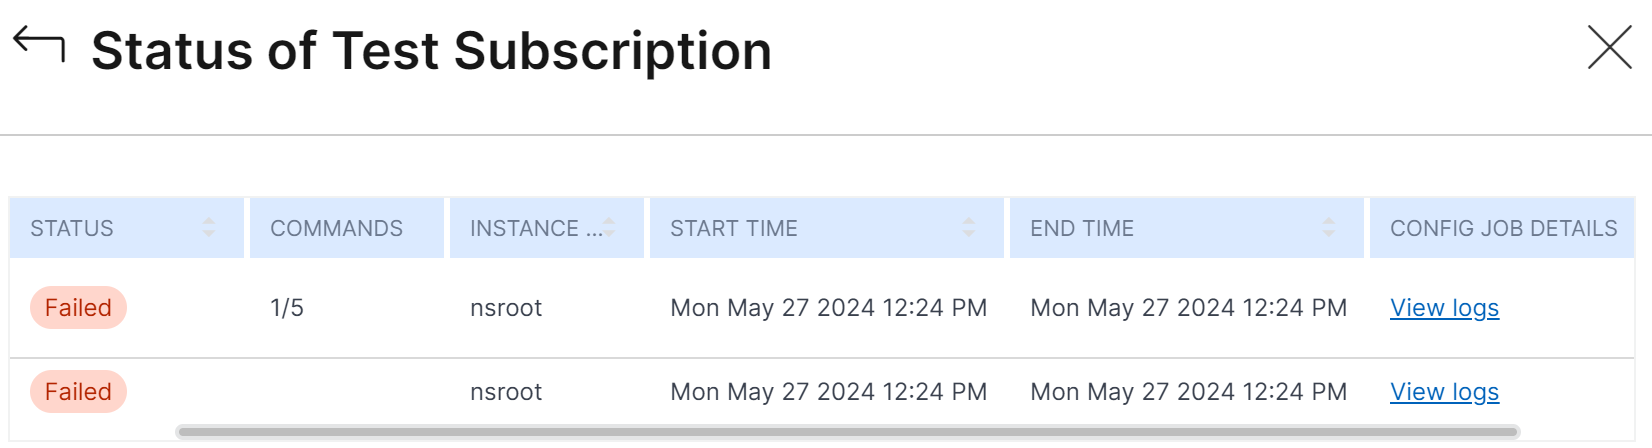
[ログを表示] をクリックして、問題の詳細を表示します。
共有
共有
この記事の概要
This Preview product documentation is Cloud Software Group Confidential.
You agree to hold this documentation confidential pursuant to the terms of your Cloud Software Group Beta/Tech Preview Agreement.
The development, release and timing of any features or functionality described in the Preview documentation remains at our sole discretion and are subject to change without notice or consultation.
The documentation is for informational purposes only and is not a commitment, promise or legal obligation to deliver any material, code or functionality and should not be relied upon in making Cloud Software Group product purchase decisions.
If you do not agree, select I DO NOT AGREE to exit.