HDX™ Insight
HDX Insight provides end-to-end visibility for HDX traffic to Citrix Virtual Apps and Desktops passing through NetScaler. It also enables administrators to view real-time client and network latency metrics, historical reports, End-to-end performance data, and troubleshoot performance issues. Availability of both real-time and historical visibility data enables NetScaler Console to support a wide variety of use cases.
For any data to appear you need to enable AppFlow on your NetScaler Gateway virtual servers. AppFlow can be delivered by the IPFIX protocol or the Logstream method.
Note
To allow ICA® round trip time calculations to be logged, enable the following policy settings:
- ICA Round Trip Calculation
- ICA Round Trip Calculation Interval
- ICA Round Trip Calculation for Idle Connections
If you click an individual user, you can see each HDX session, active or terminated, that the user made within the selected time frame. Other information includes several latency statistics and bandwidth consumed during the session. You can also get bandwidth information from individual virtual channels such as audio, printer mapping and client drive mapping.
You can also visualize a consolidated view of all users active and terminated sessions.
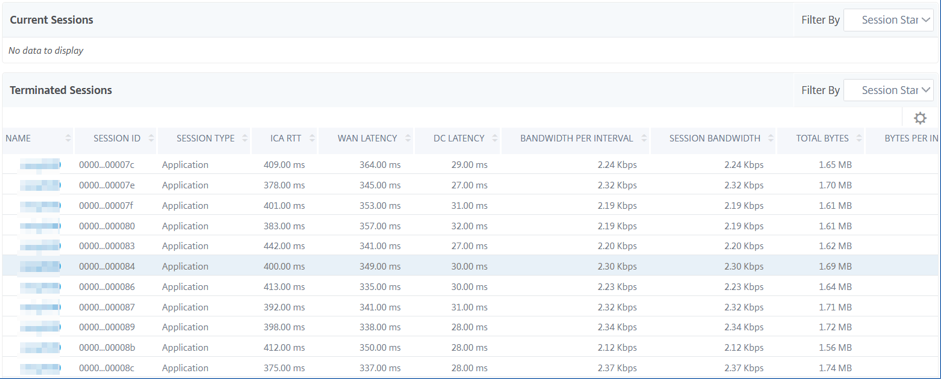
As an administrator, this view enables you to:
-
View all users details in a single-pane visualization
-
Eliminate the complexity in selecting each user and seeing the active and terminated sessions
Note
When you create a group, you can assign roles to the group, provide application-level access to the group, and assign users to the group. NetScaler Console analytics now supports virtual IP address based authorization. Your users can now see reports for all Insights for only the applications (virtual servers) that they are authorized to. For more information on groups and assigning users to the group, see Configuring Groups on NetScaler Console.
You can also navigate to HDX Insight > Applications and click Launch Duration to view the time taken for the application to launch. You can also view the user agent of all connected users by navigating to HDX Insight > Users.
Note
HDX insight supports Admin Partitions configured in NetScaler instances running on software version 12.0.
The following Thin Clients support HDX Insight:
- WYSE Windows-based Thin Clients
- WYSE Linux-based Thin Clients
- WYSE ThinOS-based Thin Clients
- 10ZiG Ubuntu-based Thin Clients
Identifying the root cause of slow performance issues
Scenario 1
User is experiencing delays while accessing Citrix Virtual Apps and Desktops
The delays might be due to latency on the server network, ICA traffic delays caused by the server network, or latency on the client network.
To identify the root cause of the issue, analyze the following metrics:
- WAN Latency
- DC Latency
- Host Delay
To view the client metrics:
- On the Analytics tab, navigate to HDX Insight > Users.
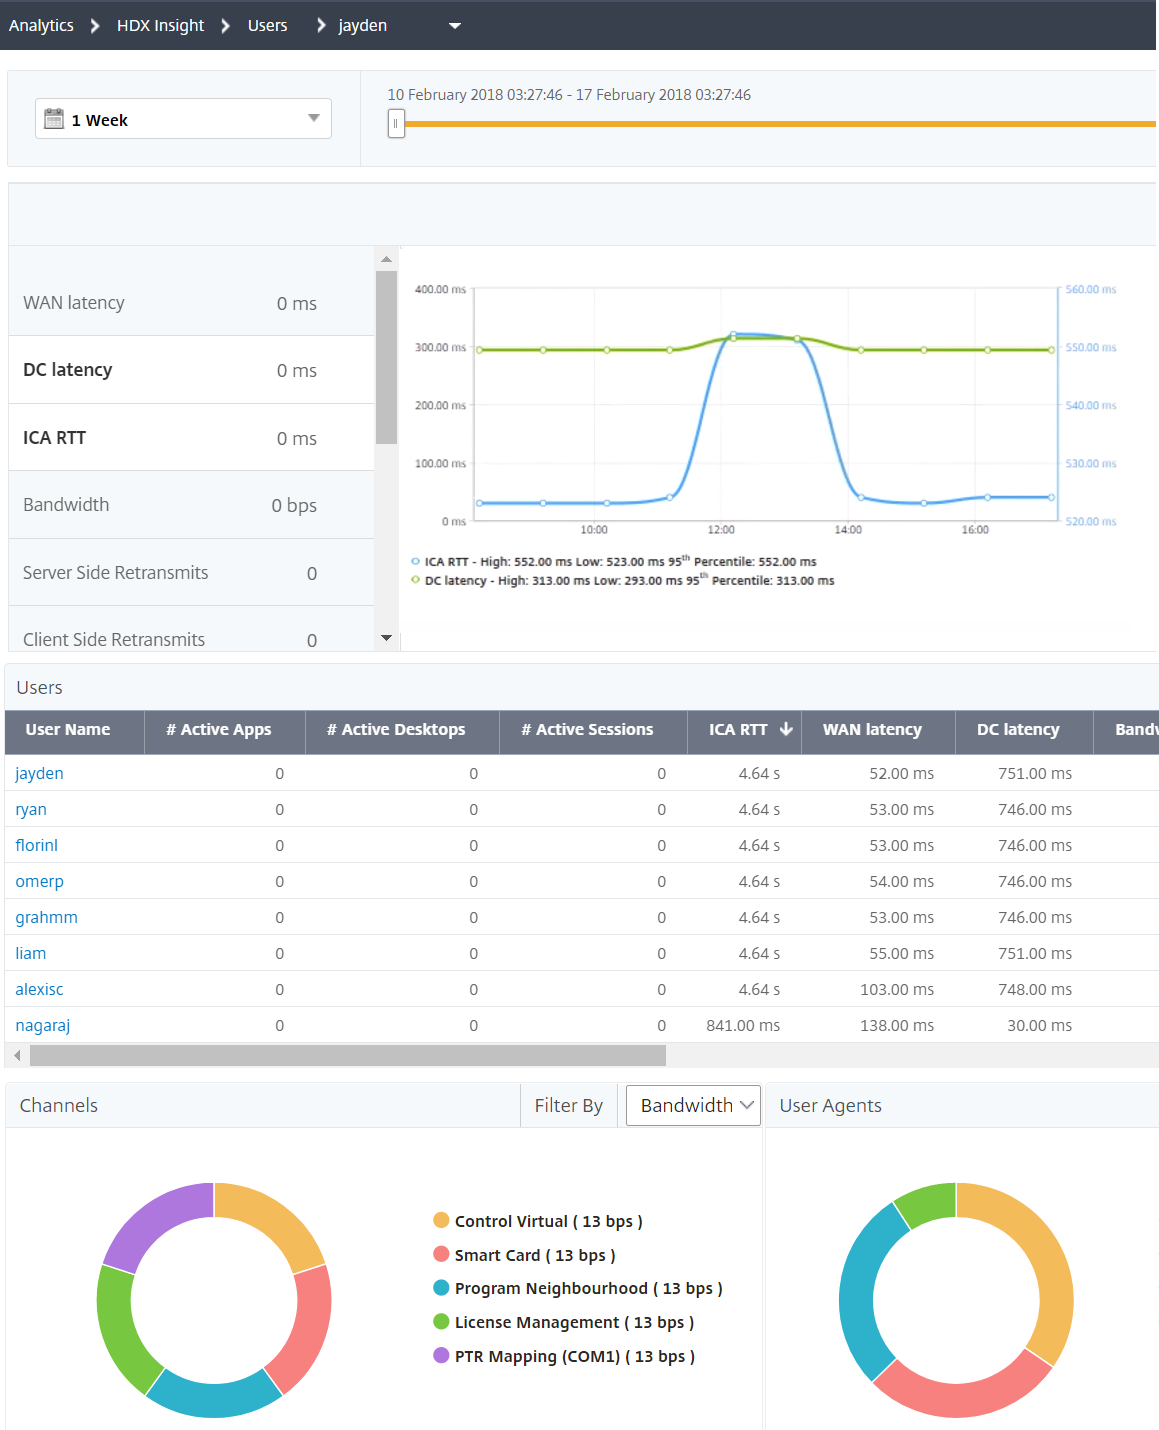
- Scroll down and select the user name and select the period from the list. The period can be one day, one week, one month, or you can even customize the period for which you want to see the data.
-
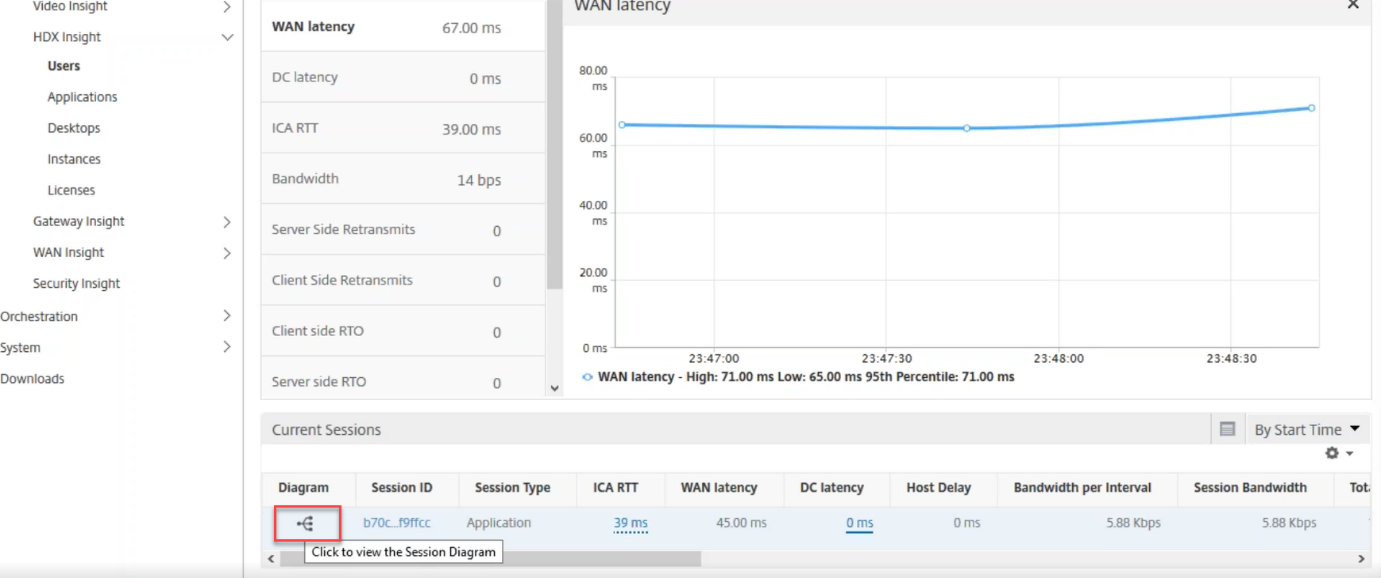
The chart displays the ICA RTT and DC latency values of the user for the specified period as a graph.
-
On the Current Application Sessions table, hover the mouse over the RTT value and note the host delay, DC latency, and WAN latency values.
-
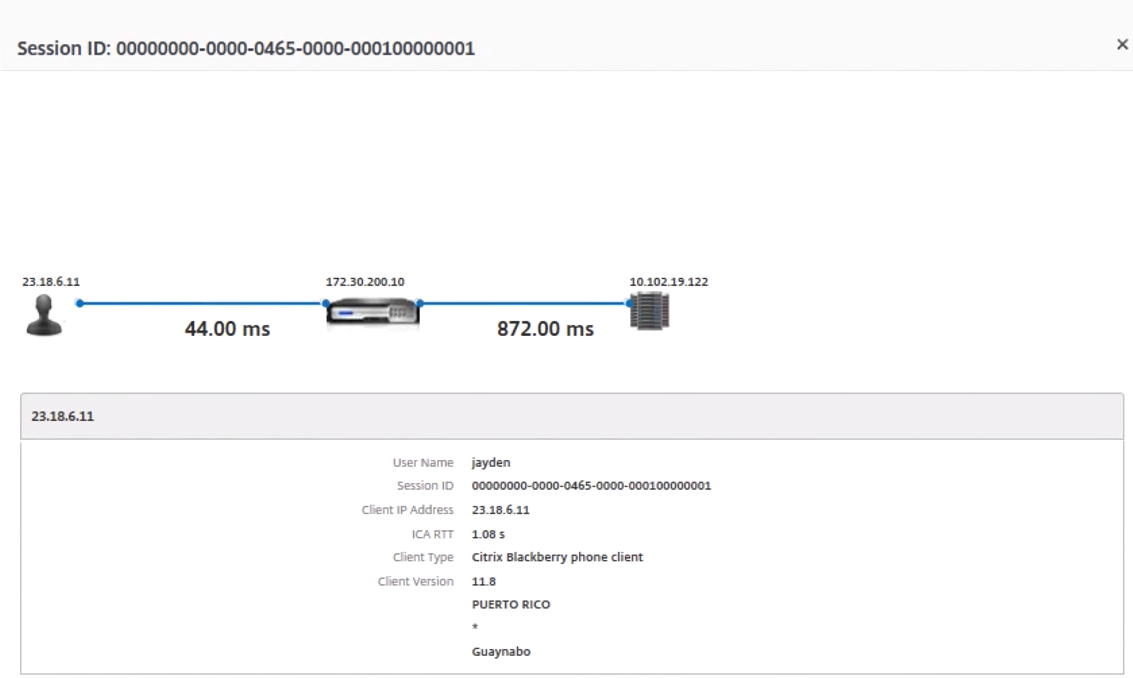
On the Current Application Sessions table, click the hop diagram symbol to display information about the connection between the client and the server, including latency values.
Summary:
In this example, the DC Latency is 751 milliseconds, the WAN latency is 52 milliseconds and Host Delays is 6 seconds. This indicates that the user is experiencing delay due to average latency caused by the server network.
Scenario 2
User is experiencing delay while launching an application on Citrix Virtual Apps™ or Desktops
The delay might be due to latency on the server network, ICA-traffic delays caused by the server network, latency on the client network, or time taken to launch an application.
To identify the root cause of the issue, analyze the following metrics:
- WAN latency
- DC latency
- Host delay
To view the user metrics:
-
Navigate to Gateway > HDX Insight > Users.
-
Scroll down and click the user name.
-
In the graphical representation, note the WAN Latency, DC Latency and RTT values for the particular session.
-
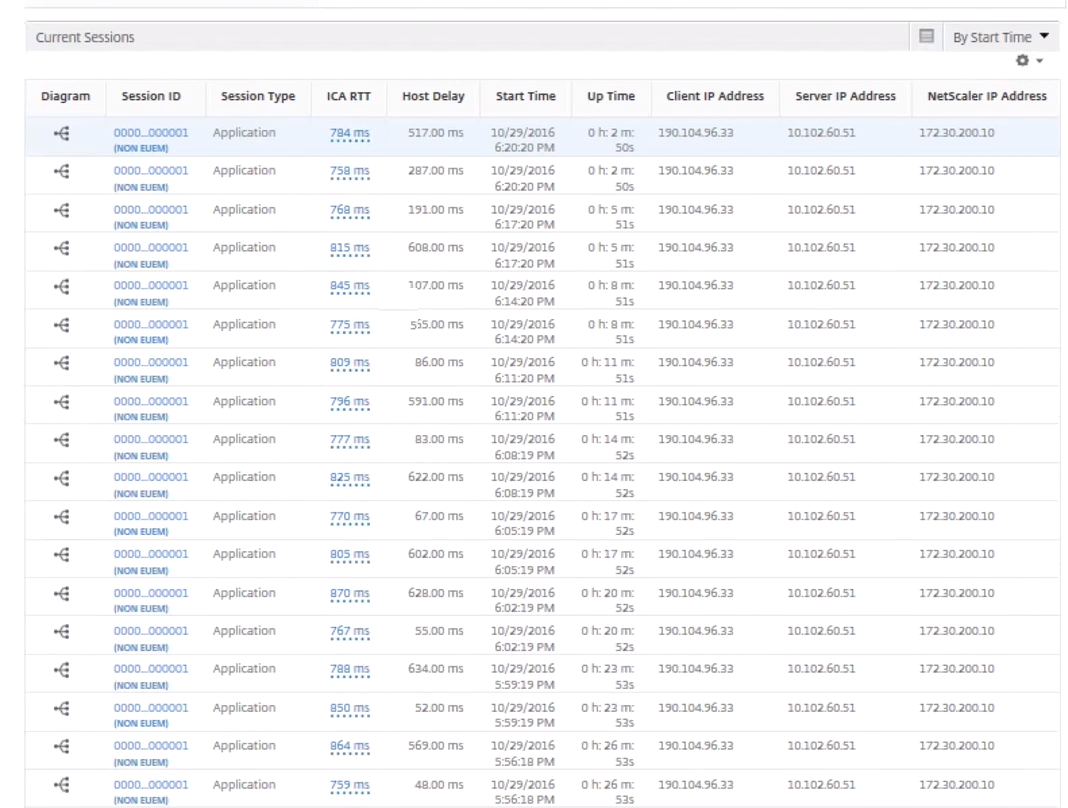
In the Current Application Sessions table, note that the host delay is high.
Summary:
In this example, the DC Latency is 1 millisecond, the WAN latency is 12 milliseconds, but the Host Delay is 517 milliseconds. High RTT with low DC and WAN latencies indicates an application error on the host server.
Note
HDX Insight also displays more user metrics, such as WAN jitter and Server Side Retransmits if you are using NetScaler Console running software 11.1 build 51.21 or later. To view these metrics, navigate to Gateway > HDX Insight > Users, and select a user name. The user metrics appear in the table next to the graph.
Geo map for HDX Insight
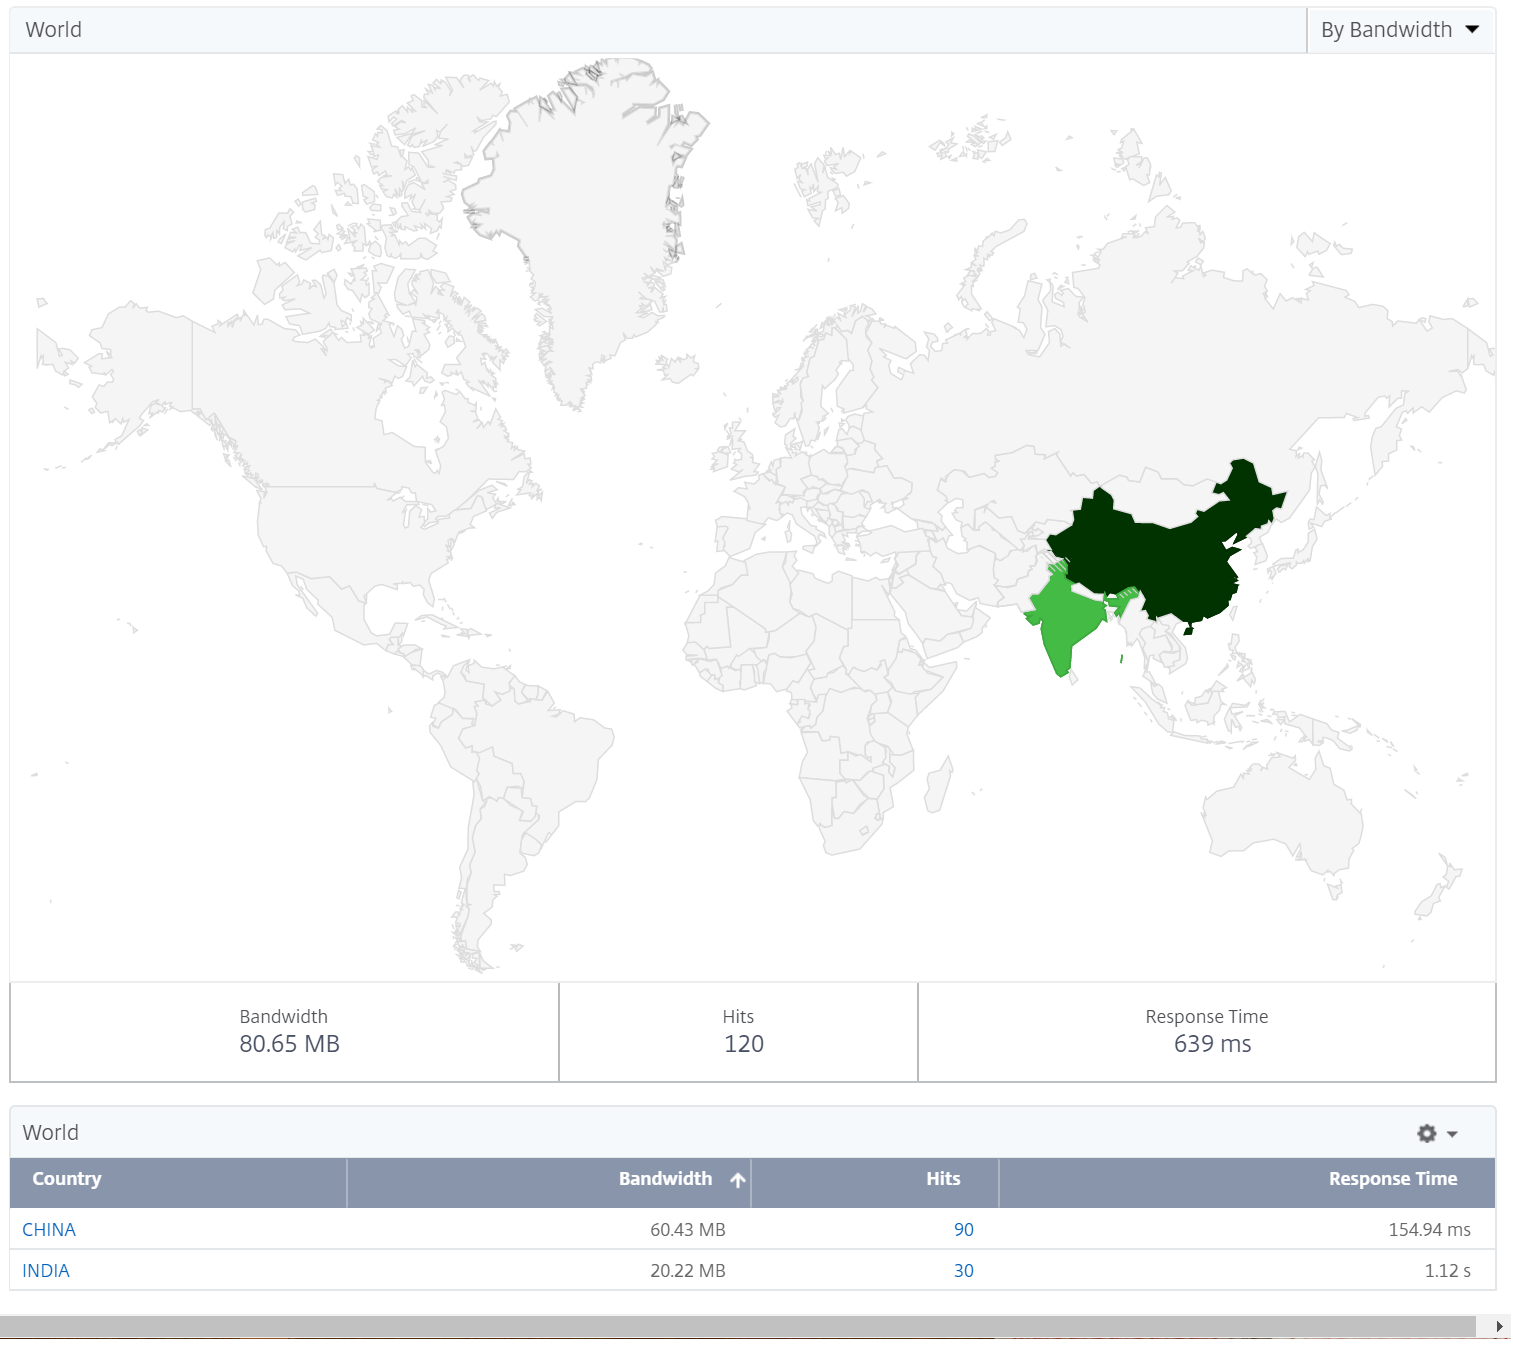
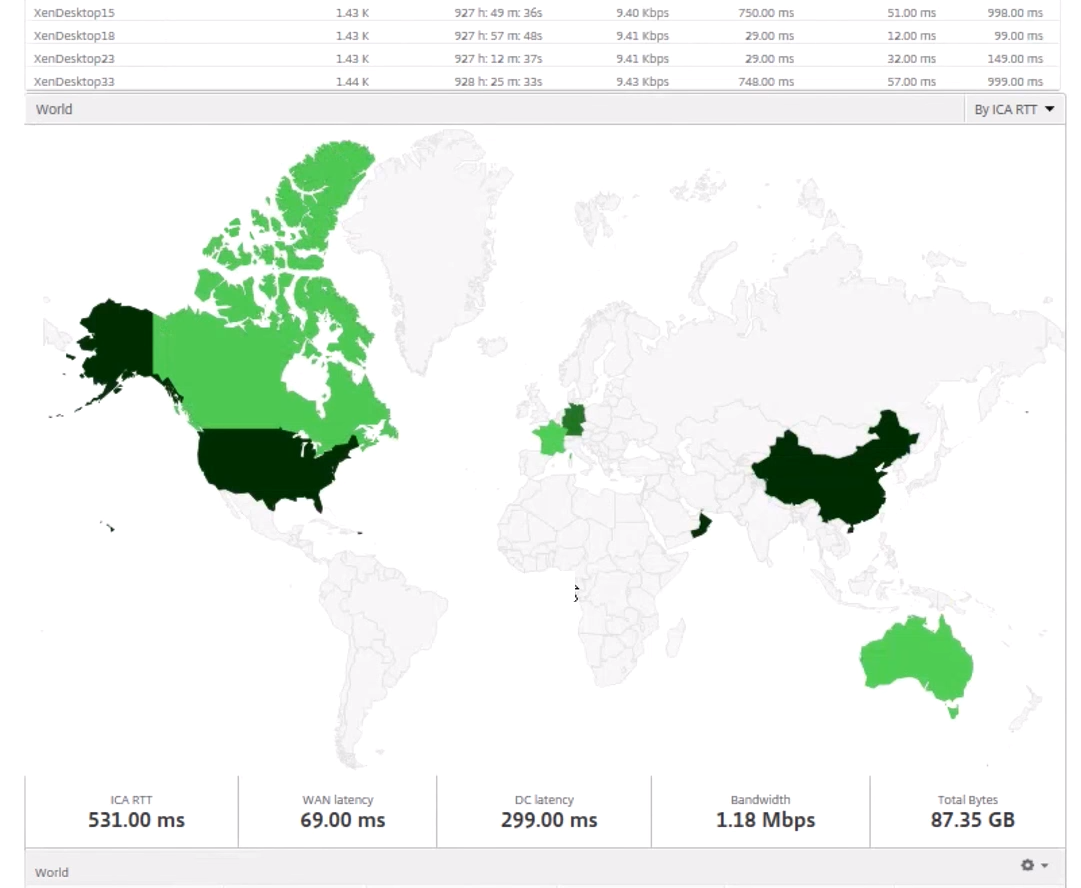
Geo map feature in NetScaler Console displays the usage of web applications across different geographical locations on a map. As an administrator, you can use this information to understand the trends in application usage and for capacity planning.
Geo map provides information about the following metrics specific to a country, state, and city:
-
Total Hits: Total number of times an application is accessed.
-
Bandwidth: Total bandwidth consumed while serving client requests
-
Response Time: Average time taken to send responses to client requests.
Geo map provides information which can be used to address several use cases such as the following:
-
Region that has the maximum number of clients accessing an application
-
Region that has the highest response time
-
Region that consumes the most bandwidth
NetScaler Console automatically enables geomaps for private IP addresses or public IP addresses, when you enable Web insight.
Create a private IP block
NetScaler Console can recognize the location of a client when the client private IP address is added to the NetScaler Console server. For example, if the IP address of a client falls within the range of a private IP address block associated with City A, NetScaler Console recognizes that the traffic is originating from City A for this client.
To create an IP block:
-
In NetScaler Console, navigate to Settings > Analytics Settings > IP Blocks, and then click Add.
-
In Create IP Blocks page, specify the following parameters:
-
Name. Specify a name for the private IP block
-
Start IP address. Specify the lowest IP address range for the IP block.
-
End IP address. Specify the highest IP address range for the IP block.
-
Country. Select the country from the list.
-
Region. Based on the country, the region is auto-populated, but you can select your region.
-
City. Based on the region, the city is auto-populated, but you can select your city.
-
City Latitude and City Longitude. Based on the city you select, the latitude and longitude are auto-populated.
-
-
Click Create to finish.
Public IP blocks
NetScaler Console can also recognize the client location if the client uses public IP address. NetScaler Console has its built-in location CSV file that matches the location based on the client IP address range. For using public IP block, the only requirement is that you have to enable the Enable geo data collection from the Configure Insight page.
Note
NetScaler Console requires an internet connection to display the geomaps for a particular geographical location. Internet connection is also required to export the GeoMap in .pdf, .png, or .jpg formats.
To export the report of this dashboard:
To export the report of this page, click the Export icon on the top right side of this page. On the Export page, you can do one of the following:
-
Select Export Now tab. To view and save the report in PDF, JPEG, PNG, or CSV format.
-
Select Schedule Export tab. To schedule the report daily, weekly, or monthly and send the report over email or slack message.
Note
- If you select Weekly recurrence, ensure that you select the weekdays on which you want the report to be scheduled.
- If you select Monthly recurrence, ensure that you enter all the days that you want the report to be scheduled separated by commas.
To configure a geomap for data centers:
On the Infrastructure tab, navigate to Sites > Private IP Blocks to configure geomaps for a particular location.
Use Case
Consider a scenario in which organization ABC has 2 branch offices, one in Santa Clara and the other in India.
The Santa Clara users use the NetScaler Gateway appliance at SClara.x.com to access VPN traffic. The Indian users use the NetScaler Gateway appliance at India.x.com to access VPN traffic.
During a particular time-interval, say 10 AM to 5 PM, the users in Santa Clara connect to SClara.x.com to access VPN traffic. Most of the users access the same NetScaler Gateway, causing a delay in connecting to the VPN, so some users connect to India.x.com instead of SClara.x.com.
A NetScaler administrator analyzing the traffic can use the geo map functionality to show the traffic in Santa Clara office. The map shows that the response time in the Santa Clara office is high, because the Santa Clara office has only one NetScaler Gateway appliance through which users can access VPN traffic. The administrator might therefore decide to install another NetScaler Gateway, so that users have two local NetScaler Gateway appliances through which to access the VPN.
Limitations
If NetScaler instances have Advanced license, thresholds set on NetScaler Console for HDX Insight will not be triggered since analytical data is collected for only 1 hour.
To export the report of this dashboard:
To export the report of this page, click the Export icon on the top right side of this page. On the Export page, you can do one of the following:
-
Select Export Now tab. To view and save the report in PDF, JPEG, PNG, or CSV format.
-
Select Schedule Export tab. To schedule the report daily, weekly, or monthly and send the report over email or slack message.
Note
- If you select Weekly recurrence, ensure that you select the weekdays on which you want the report to be scheduled.
- If you select Monthly recurrence, ensure that you enter all the days that you want the report to be scheduled separated by commas.