-
Low-touch onboarding of NetScaler instances using Console Advisory Connect
-
-
Console on-prem instances connected with Console service using Cloud Connect
-
-
Configure NetScaler instances for the export of insights to Prometheus
-
Configure the export of NetScaler metrics and audit logs to Splunk
-
This content has been machine translated dynamically.
Dieser Inhalt ist eine maschinelle Übersetzung, die dynamisch erstellt wurde. (Haftungsausschluss)
Cet article a été traduit automatiquement de manière dynamique. (Clause de non responsabilité)
Este artículo lo ha traducido una máquina de forma dinámica. (Aviso legal)
此内容已经过机器动态翻译。 放弃
このコンテンツは動的に機械翻訳されています。免責事項
이 콘텐츠는 동적으로 기계 번역되었습니다. 책임 부인
Este texto foi traduzido automaticamente. (Aviso legal)
Questo contenuto è stato tradotto dinamicamente con traduzione automatica.(Esclusione di responsabilità))
This article has been machine translated.
Dieser Artikel wurde maschinell übersetzt. (Haftungsausschluss)
Ce article a été traduit automatiquement. (Clause de non responsabilité)
Este artículo ha sido traducido automáticamente. (Aviso legal)
この記事は機械翻訳されています.免責事項
이 기사는 기계 번역되었습니다.책임 부인
Este artigo foi traduzido automaticamente.(Aviso legal)
这篇文章已经过机器翻译.放弃
Questo articolo è stato tradotto automaticamente.(Esclusione di responsabilità))
Translation failed!
Configure NetScaler® instances for the export of insights to Prometheus using the default schema
NetScaler supports directly exporting metrics to Prometheus. You can use the rich set of metrics provided by NetScaler instance to monitor NetScaler health and application health. For example, you can gather metrics on CPU and memory usage to know the NetScaler health. Similarly, you can use metrics like the number of HTTP requests received per second or the number of active clients to monitor application health.
To export the metrics to Prometheus, you must configure an analytics profile with type as time series. For more information, see Monitor NetScaler, applications, and application security using Prometheus.
With the Observability Integration feature in NetScaler Console, you can configure the export of insights to Prometheus using the default schema.
-
Navigate to Settings > Observability Integration.
-
In the Integrations page, click Add.
-
In the Create Subscription page, specify the following details:
-
Specify a name of your choice in the Subscription Name field.
-
Select NetScaler as the Source and click Next.
-
Select Prometheus as the Destination.
-
Select Default for the default insights to the exported.
-
Click Add Instances and select the instances for which you want to export insights to Prometheus.
-
Click Submit.
-
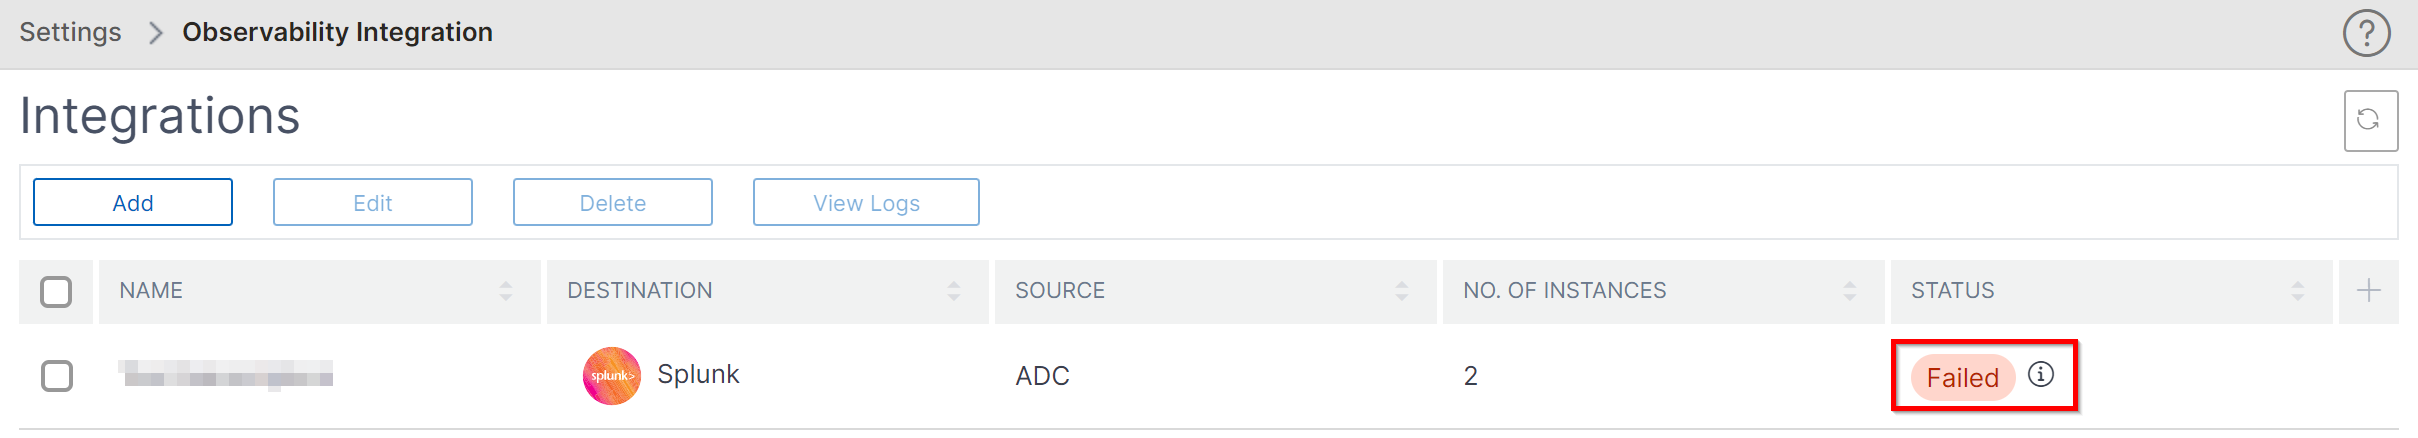
View logs for failed configurations
After you create a subscription, you can view the status of the created subscription at Settings > Observability Integration. If the status shows Failed, click to view details.
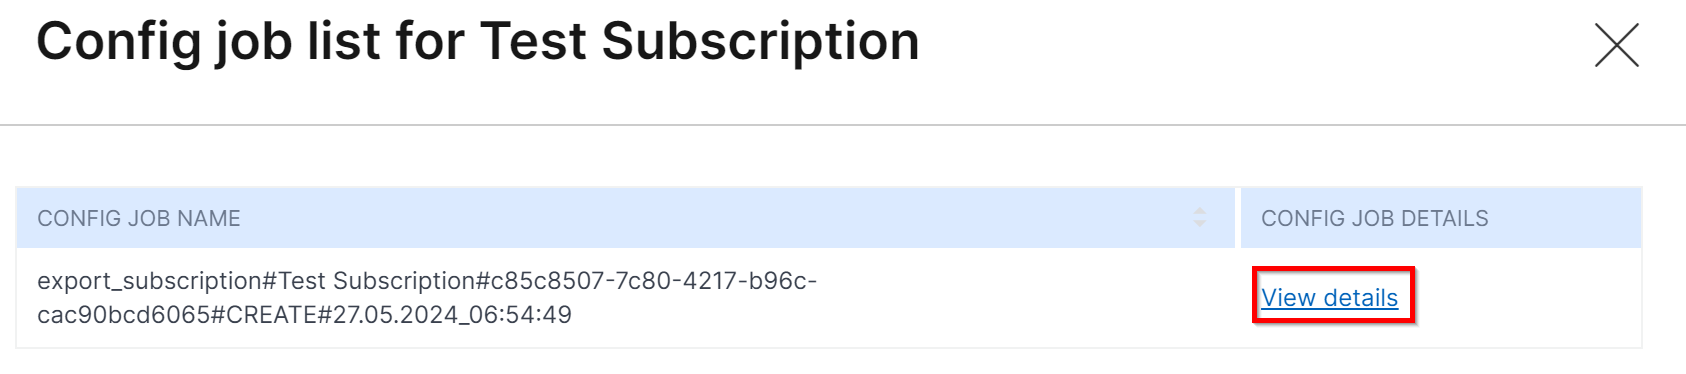
Click View details under Config job details.
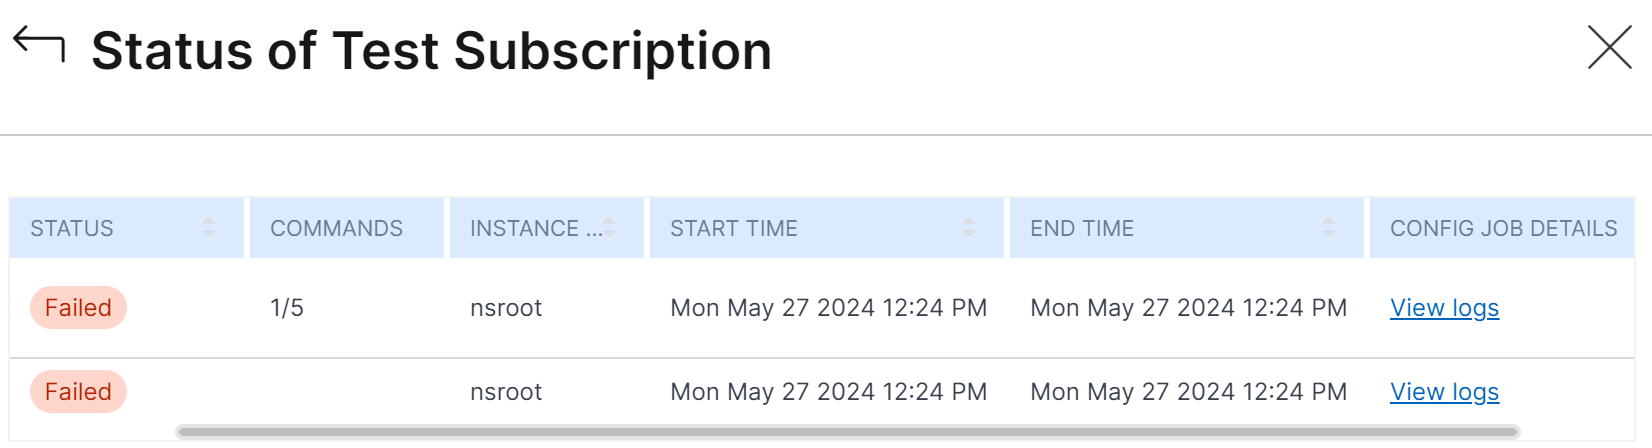
Click View logs to view details of the issue.
Share
Share
In this article
This Preview product documentation is Cloud Software Group Confidential.
You agree to hold this documentation confidential pursuant to the terms of your Cloud Software Group Beta/Tech Preview Agreement.
The development, release and timing of any features or functionality described in the Preview documentation remains at our sole discretion and are subject to change without notice or consultation.
The documentation is for informational purposes only and is not a commitment, promise or legal obligation to deliver any material, code or functionality and should not be relied upon in making Cloud Software Group product purchase decisions.
If you do not agree, select I DO NOT AGREE to exit.