-
Low-touch onboarding of NetScaler instances using Console Advisory Connect
-
-
-
Enhanced Infrastructure Analytics with new indicators
-
-
This content has been machine translated dynamically.
Dieser Inhalt ist eine maschinelle Übersetzung, die dynamisch erstellt wurde. (Haftungsausschluss)
Cet article a été traduit automatiquement de manière dynamique. (Clause de non responsabilité)
Este artículo lo ha traducido una máquina de forma dinámica. (Aviso legal)
此内容已经过机器动态翻译。 放弃
このコンテンツは動的に機械翻訳されています。免責事項
이 콘텐츠는 동적으로 기계 번역되었습니다. 책임 부인
Este texto foi traduzido automaticamente. (Aviso legal)
Questo contenuto è stato tradotto dinamicamente con traduzione automatica.(Esclusione di responsabilità))
This article has been machine translated.
Dieser Artikel wurde maschinell übersetzt. (Haftungsausschluss)
Ce article a été traduit automatiquement. (Clause de non responsabilité)
Este artículo ha sido traducido automáticamente. (Aviso legal)
この記事は機械翻訳されています.免責事項
이 기사는 기계 번역되었습니다.책임 부인
Este artigo foi traduzido automaticamente.(Aviso legal)
这篇文章已经过机器翻译.放弃
Questo articolo è stato tradotto automaticamente.(Esclusione di responsabilità))
Translation failed!
Enhanced Infrastructure Analytics with new indicators
Using the NetScaler Console Infrastructure Analytics, you can:
-
View a new set of operational issues that occur in NetScaler instances.
-
View error messages and check recommendations to troubleshoot the issues.
As an administrator, you can quickly identify the root cause analysis of issues.
Note:
Rule indicators are not supported for:
NetScaler instances configured in a cluster mode.
NetScaler instances configured with admin partitions.
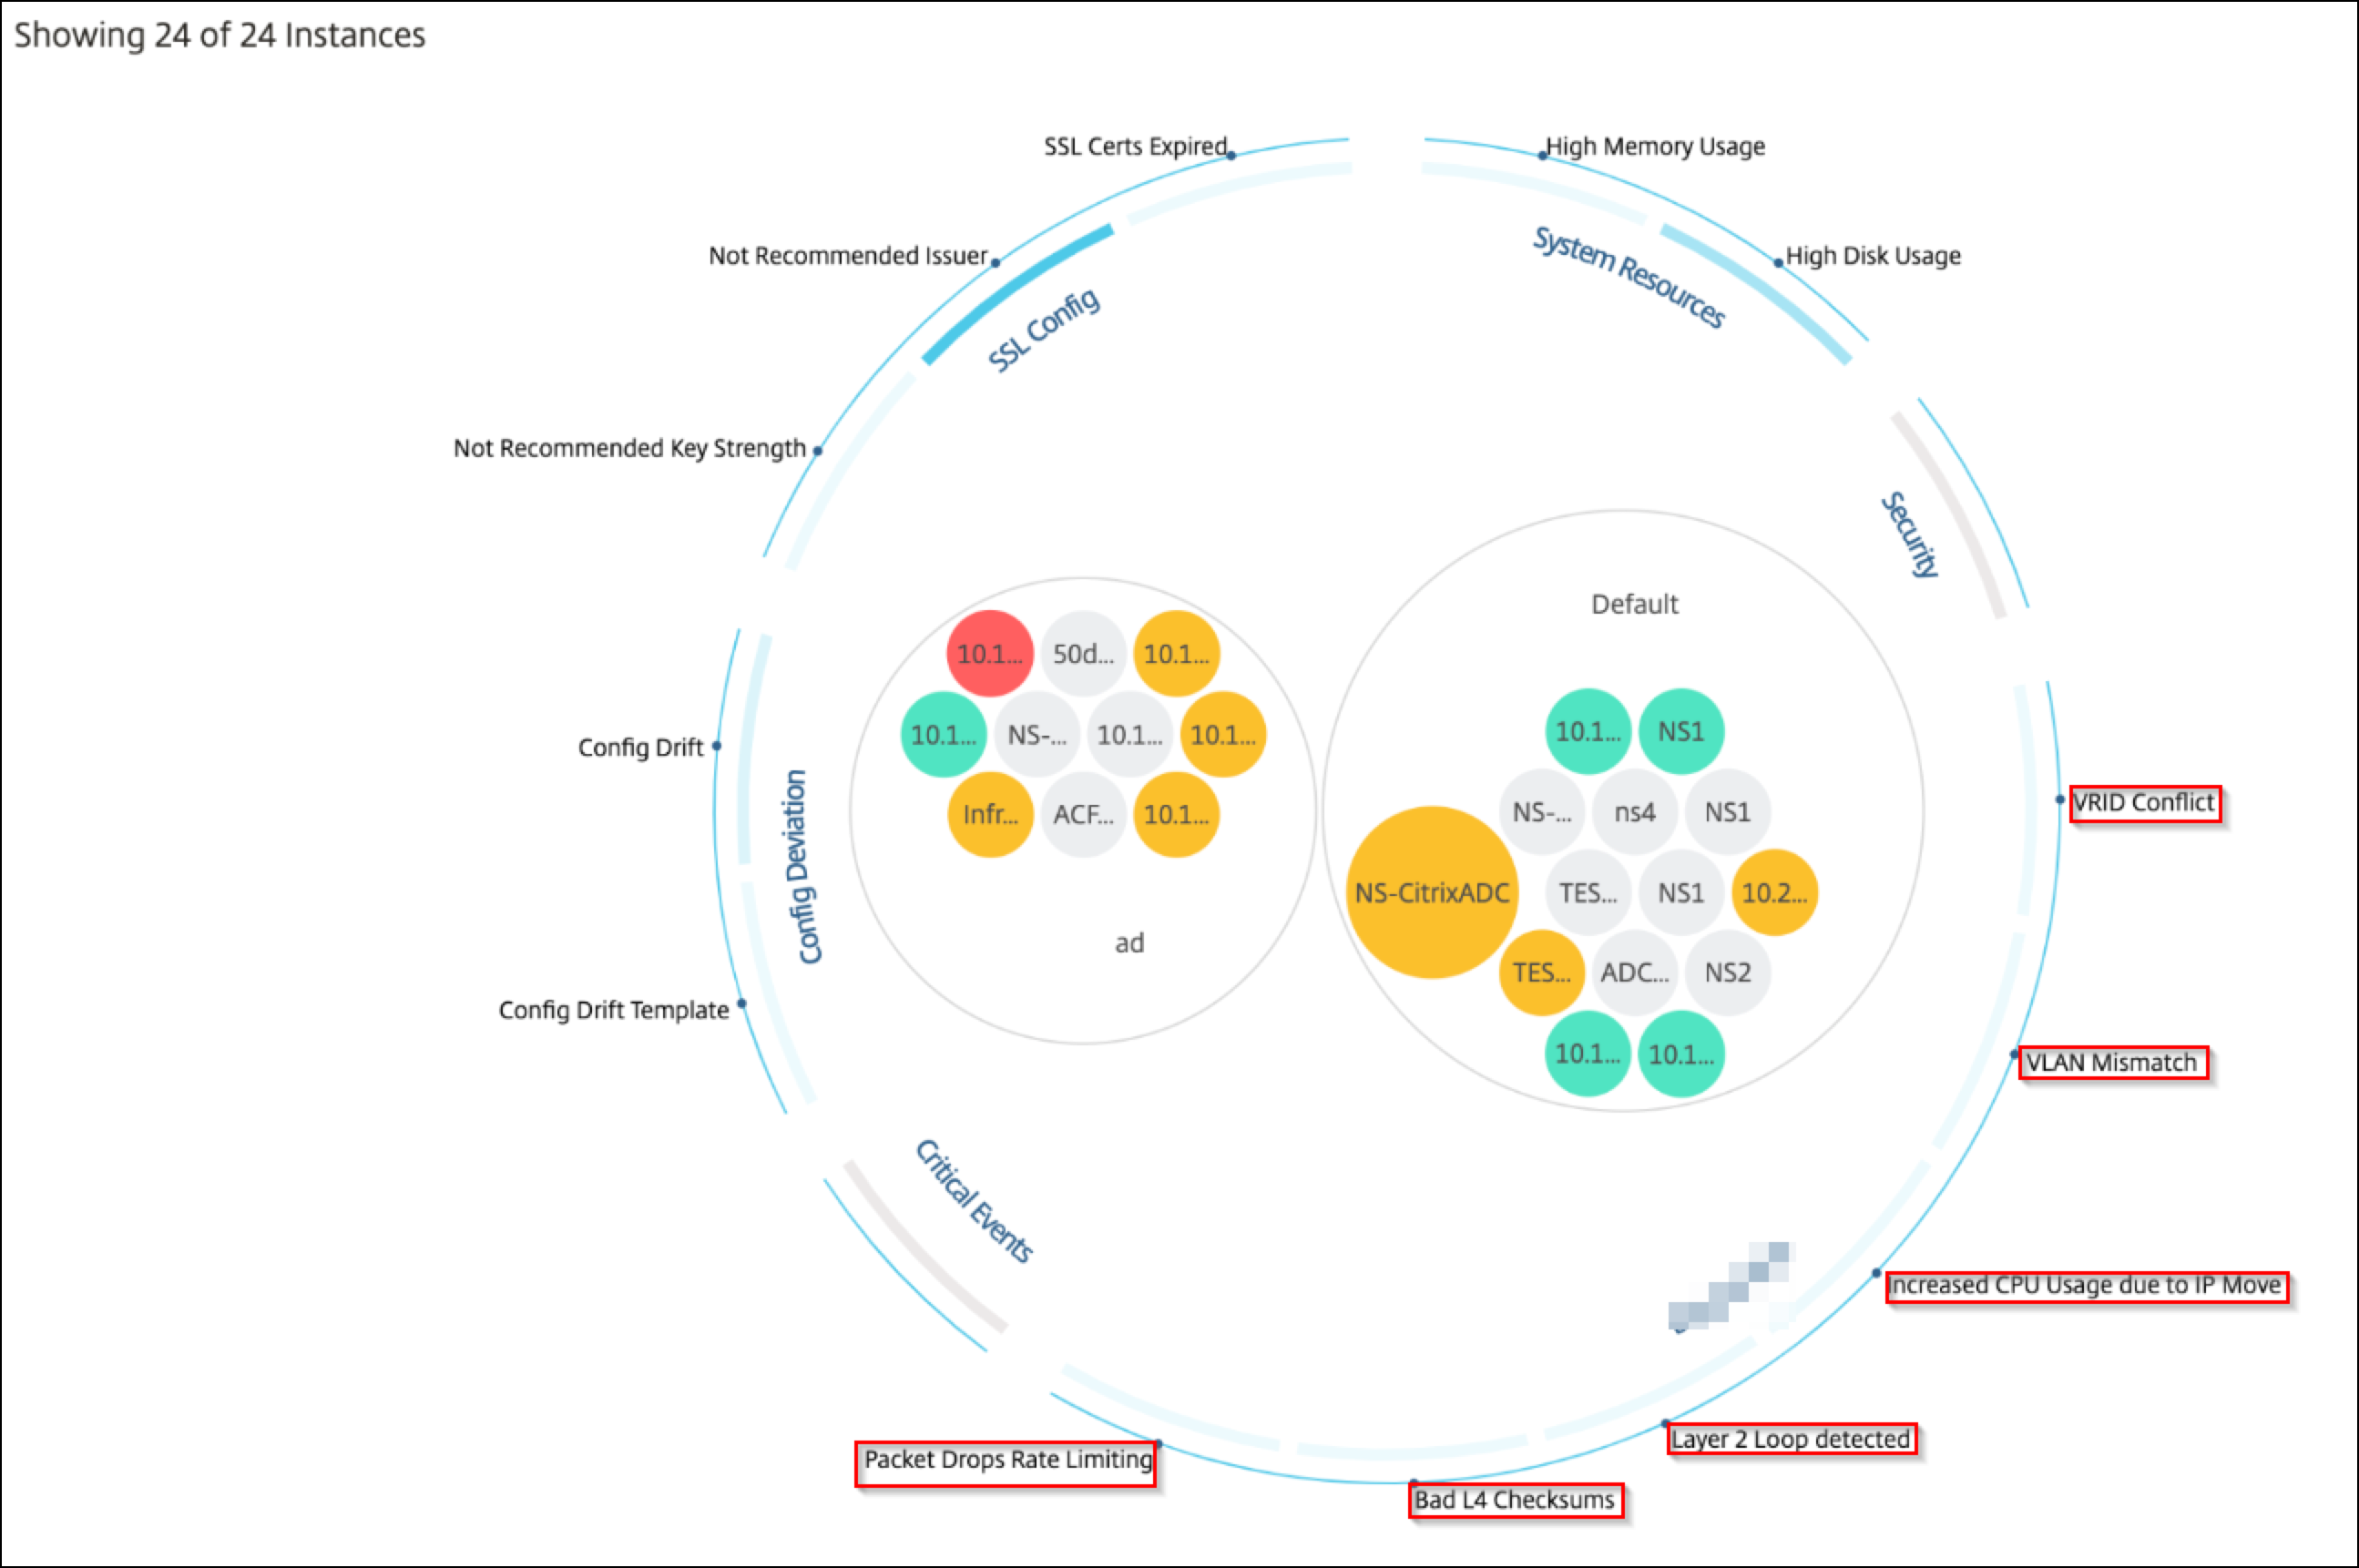
In NetScaler Console, navigate to Infrastructure > Infrastructure Analytics to view indicators for:
| Indicator name in Infrastructure Analytics | Description |
|---|---|
| Port allocation failure | Detects when NetScaler uses SNIP to communicate with a new server connection and total ports available on that SNIP are exhausted. The recommended action is to add another SNIP in the same subnet. |
| Session Buildup | Detects when NetScaler memory is held up by SSL sessions. |
| No default route configuration | Detects when the traffic gets dropped because of non-availability of routes. |
| IP conflict | Detects if a same IP address is configured or applied on two or more instances in a network. |
| VRID conflict | Detects when intermittent access problems occur for the specified VRID. |
| VLAN mismatch | Detects if any errors occur during VLAN configuration bound to IP subnets. |
| TCP small window attack | Detects when there is a possible small window attack in progress. This alert is just for informational, because NetScaler already mitigates this attack. |
| Rate control threshold | Detects when packets are dropped based on the configured rate control threshold. |
| Persistence Limit | Detects when maximum hits are imposed on the NetScaler memory. |
| GSLB site name mismatch | Detects when GSLB configuration synchronization failures occur because of site name mismatch. |
| Malformed IP header | Detects when sanity checks on IPv4 packets are failed. |
| Bad L4 checksums | Detects when checksum validation for TCP packets is failed. |
| Increased CPU usage due to IP move | Detects if a large number of macs need to be updated. |
| Excessive packet steering | Detects high levels of software packet steering due to the usage of asymmetric rss key type. |
| Layer 2 loop | Detects the presence of layer 2 loops in the network. |
| Tagged VLAN mismatch | Detects when tagged VLAN packets are received on an untagged interface. |

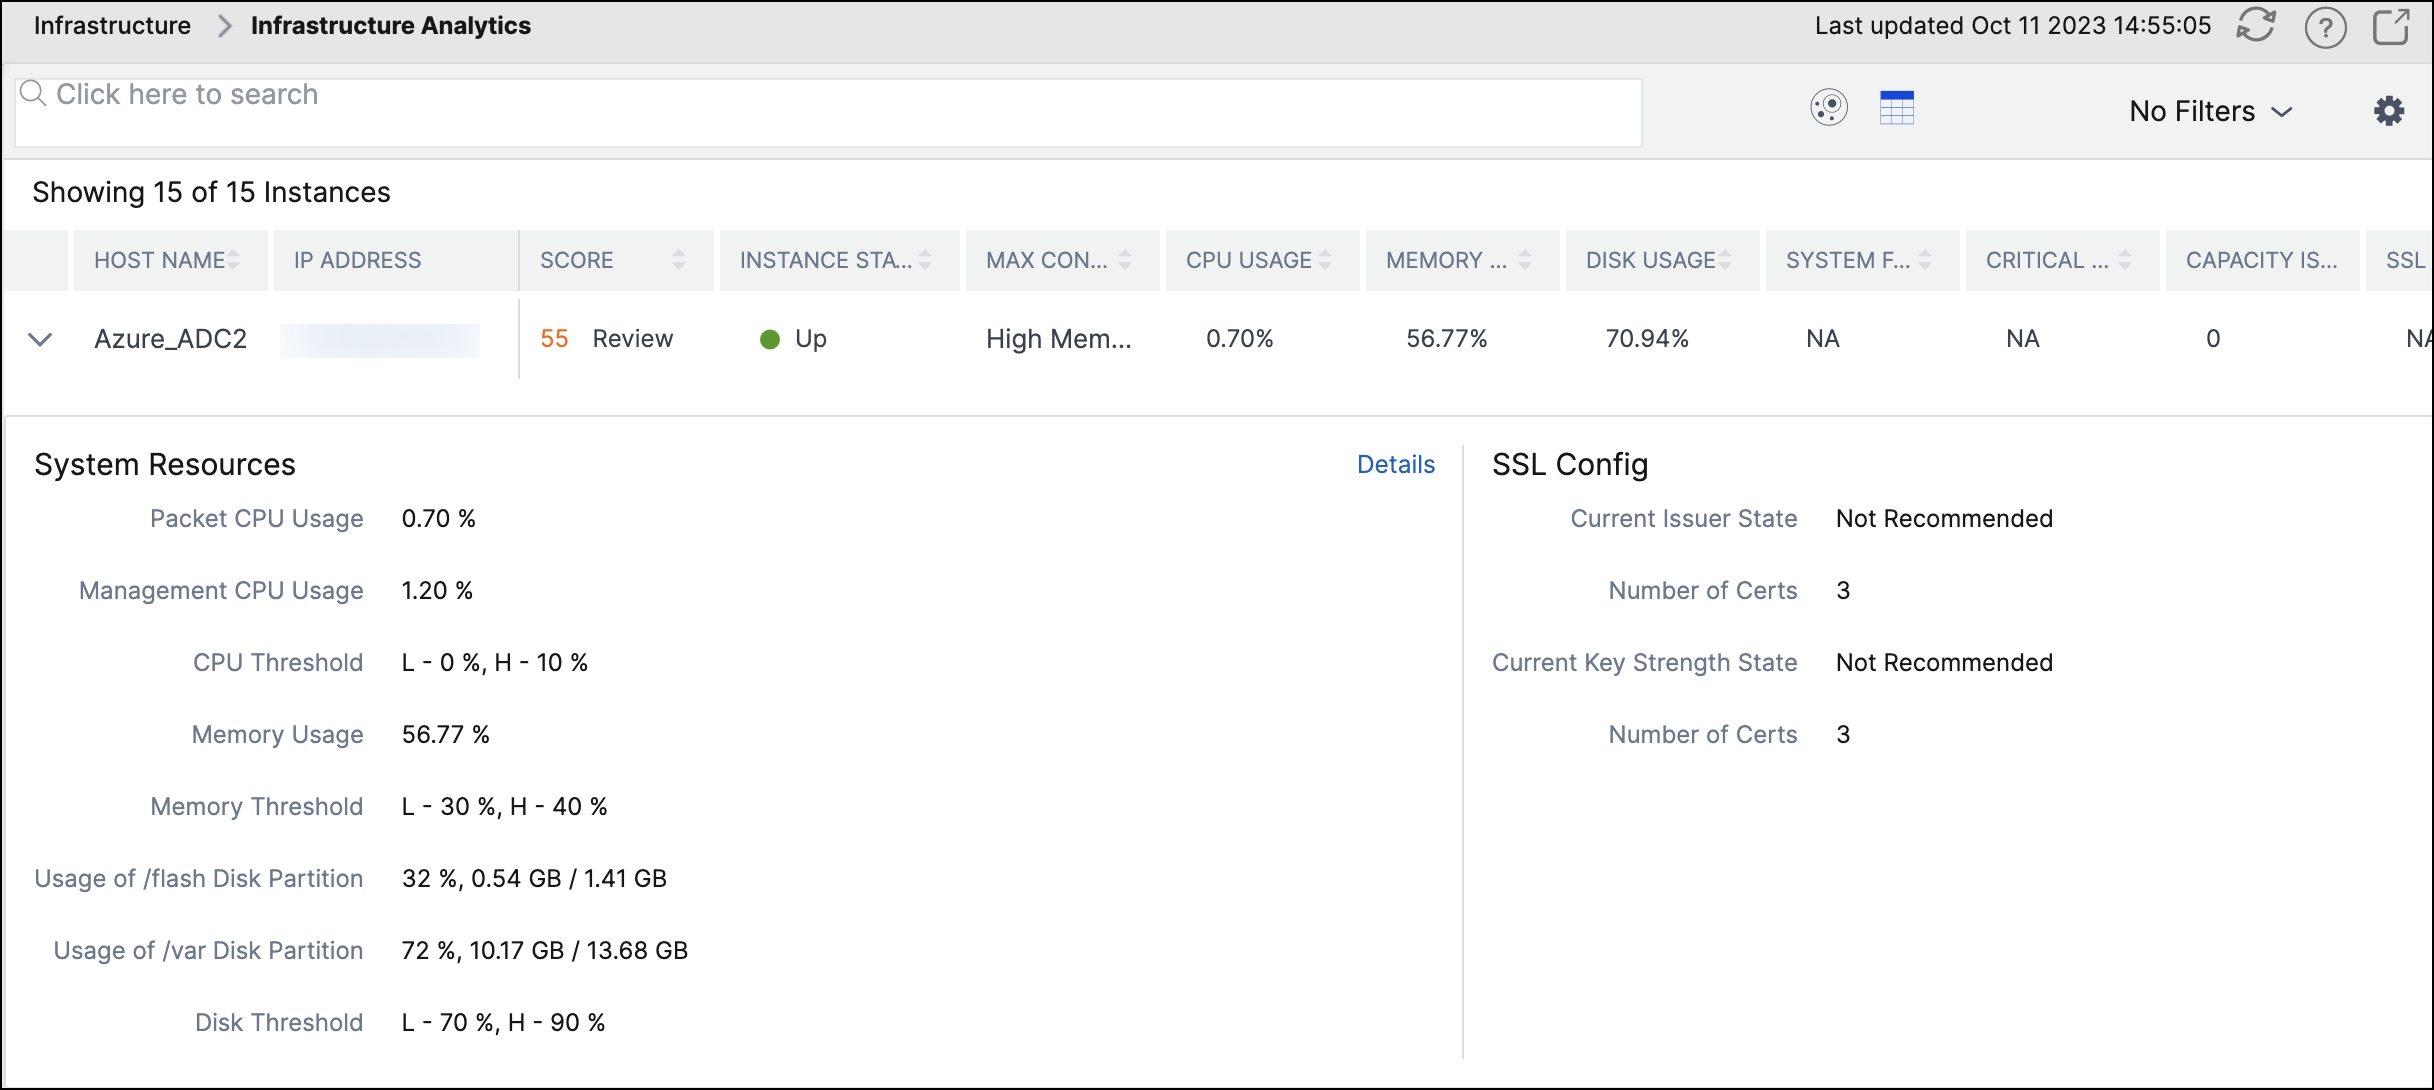
Tabular view
You can also view anomalies using the tabular view option in Infrastructure Analytics. Navigate to Infrastructure > Infrastructure Analytics and then click  to display all managed instances. Click
  to expand for details.

View details of an anomaly
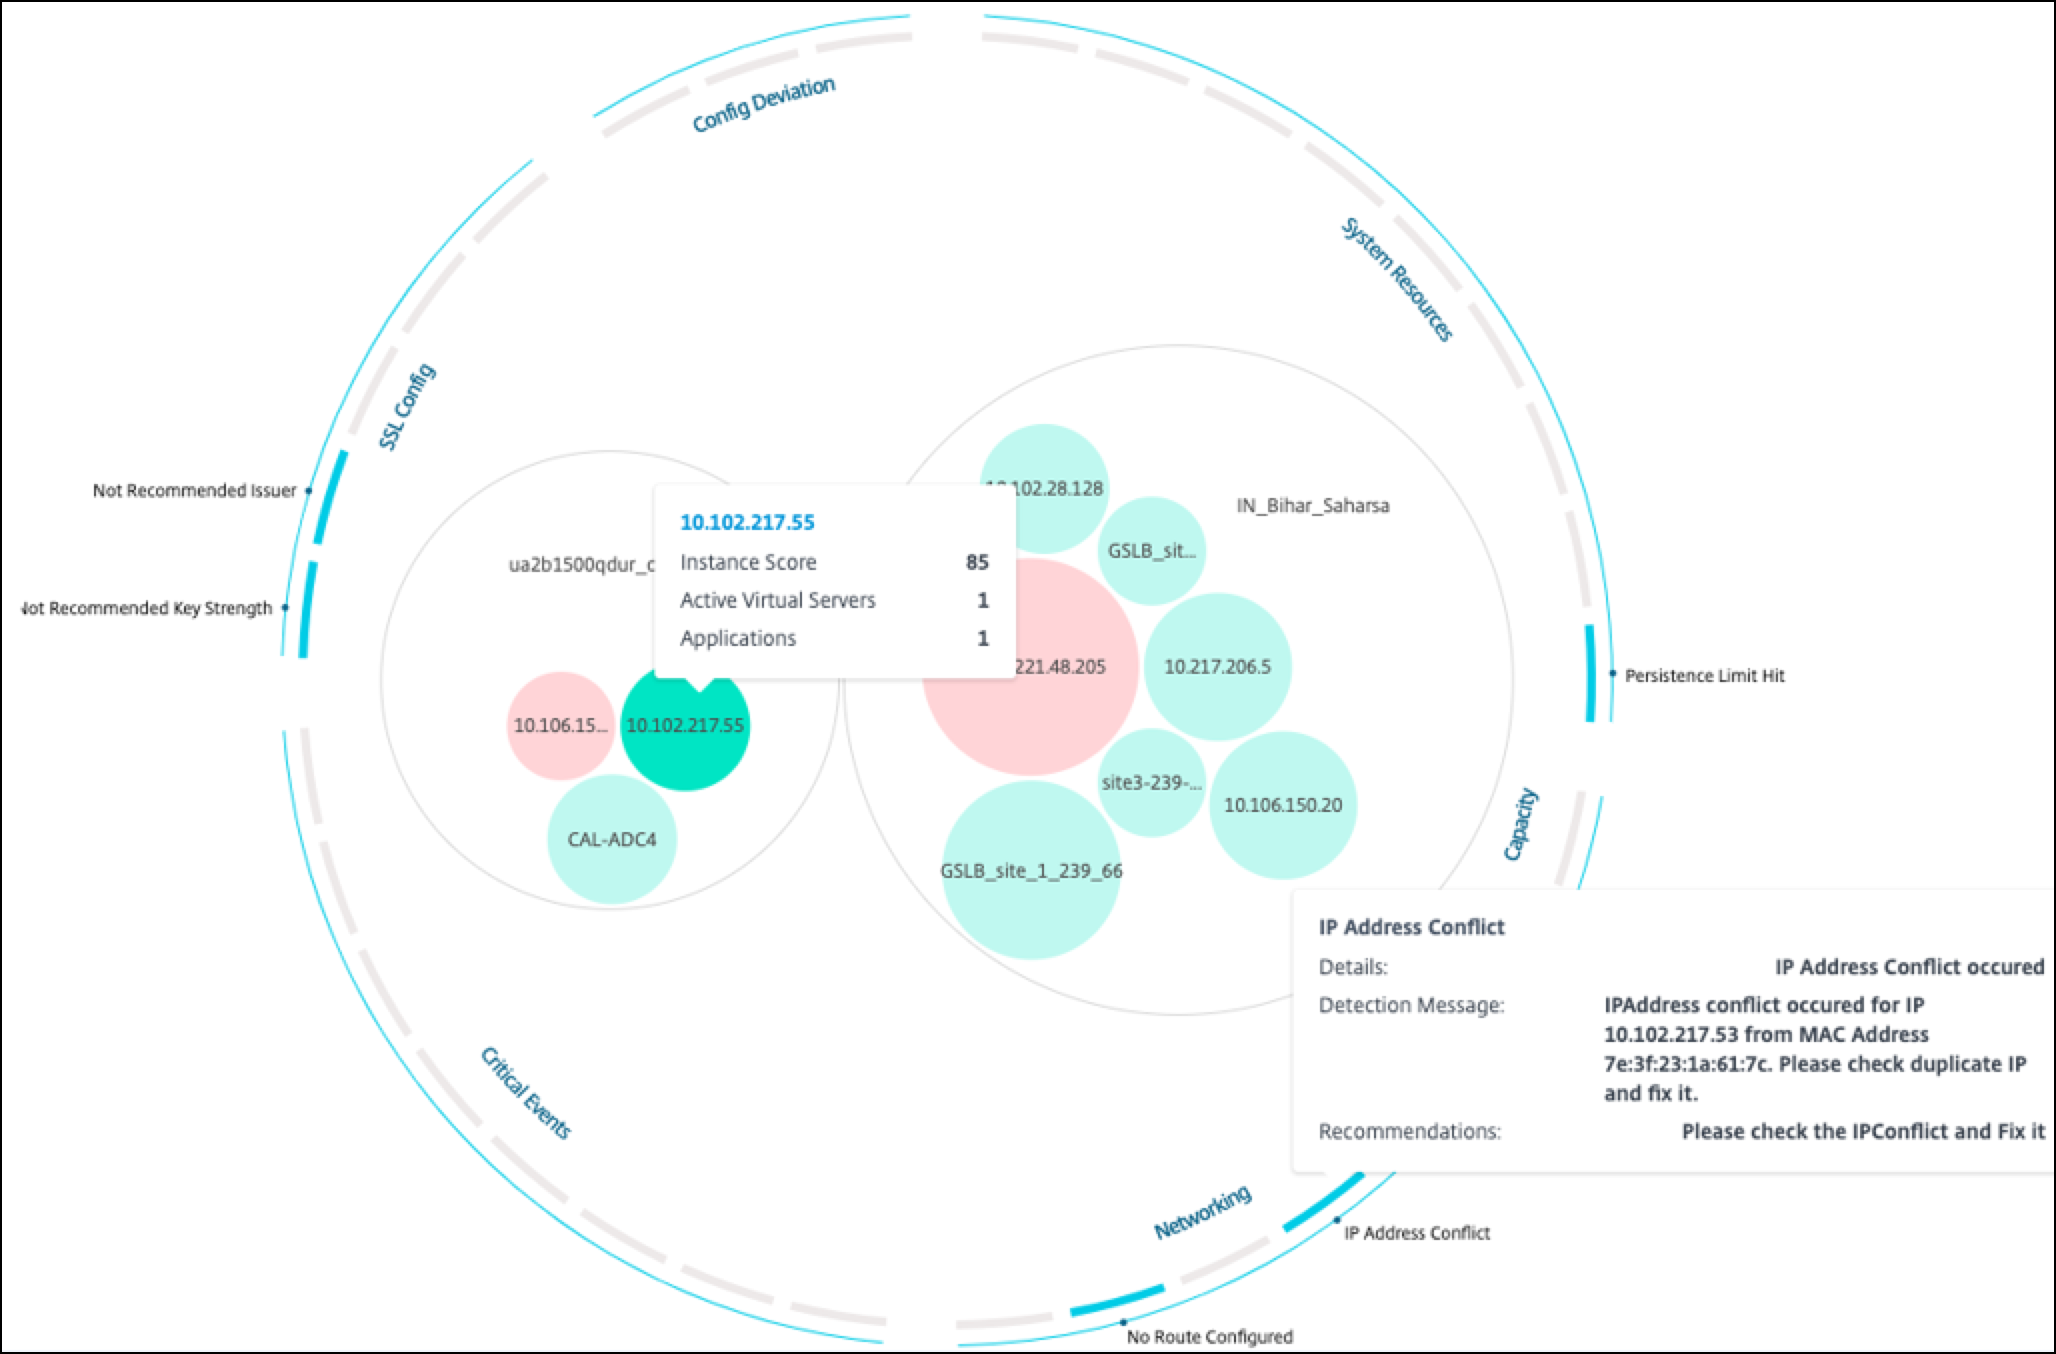
For example, if you want to view details for IP address conflict in the network, click the anomaly that is displayed for IP address conflict.

-
Details - Indicates what anomaly is detected
-
Detection Message - Indicates the MAC address for which the IP address has the conflict
-
Recommendations - Indicates the troubleshooting procedure to resolve this IP address conflict
Share
Share
In this article
This Preview product documentation is Cloud Software Group Confidential.
You agree to hold this documentation confidential pursuant to the terms of your Cloud Software Group Beta/Tech Preview Agreement.
The development, release and timing of any features or functionality described in the Preview documentation remains at our sole discretion and are subject to change without notice or consultation.
The documentation is for informational purposes only and is not a commitment, promise or legal obligation to deliver any material, code or functionality and should not be relied upon in making Cloud Software Group product purchase decisions.
If you do not agree, select I DO NOT AGREE to exit.