-
Low-touch onboarding of NetScaler instances using Console Advisory Connect
-
Unified dashboard overview
This content has been machine translated dynamically.
Dieser Inhalt ist eine maschinelle Übersetzung, die dynamisch erstellt wurde. (Haftungsausschluss)
Cet article a été traduit automatiquement de manière dynamique. (Clause de non responsabilité)
Este artículo lo ha traducido una máquina de forma dinámica. (Aviso legal)
此内容已经过机器动态翻译。 放弃
このコンテンツは動的に機械翻訳されています。免責事項
이 콘텐츠는 동적으로 기계 번역되었습니다. 책임 부인
Este texto foi traduzido automaticamente. (Aviso legal)
Questo contenuto è stato tradotto dinamicamente con traduzione automatica.(Esclusione di responsabilità))
This article has been machine translated.
Dieser Artikel wurde maschinell übersetzt. (Haftungsausschluss)
Ce article a été traduit automatiquement. (Clause de non responsabilité)
Este artículo ha sido traducido automáticamente. (Aviso legal)
この記事は機械翻訳されています.免責事項
이 기사는 기계 번역되었습니다.책임 부인
Este artigo foi traduzido automaticamente.(Aviso legal)
这篇文章已经过机器翻译.放弃
Questo articolo è stato tradotto automaticamente.(Esclusione di responsabilità))
Translation failed!
A unified dashboard to view instance key metric details
In NetScaler Console, you can view various insights about the usage and performance of applications, NetScaler infrastructure, security (Bot and WAF) violations, and so on. As an administrator, you might have to navigate to various options in the NetScaler Console GUI to view multiple insights. For example, to check the virtual servers (applications) and NetScaler instance insights:
-
You must first navigate to Applications > Dashboard to view insights for applications.
-
Then you must navigate to Infrastructure > Infrastructure Analytics to view insights for NetScaler instances.
For a better monitoring experience, it is necessary for you to have a privilege that contains an overview of all the required insights. Navigate to Overview > Dashboard to visualize a single-pane dashboard with an overview of the key metrics details based on the following categories:
-
Applications
-
NetScaler Infrastructure
-
Application security
-
Gateway
-
API analytics
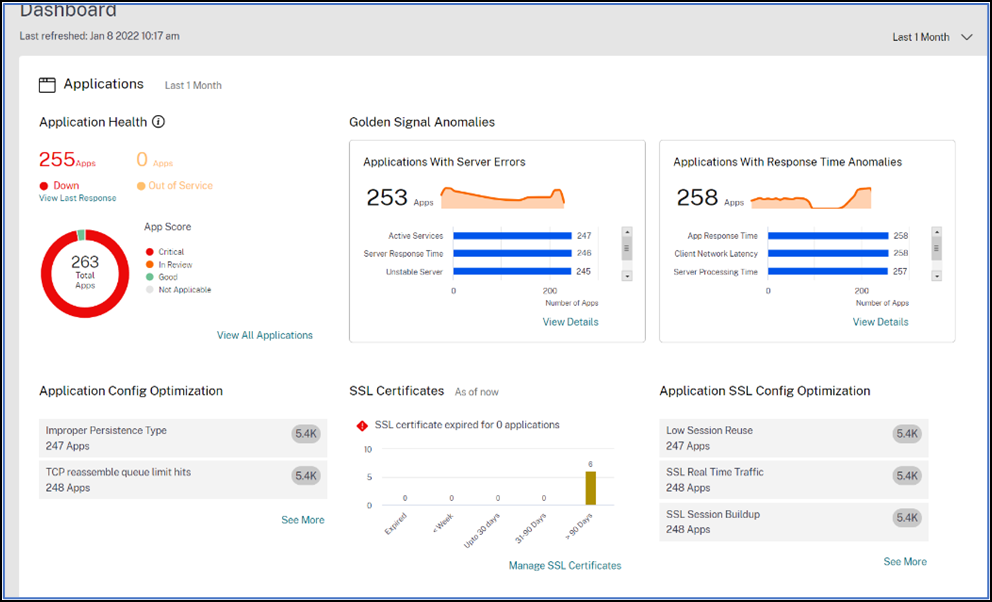
Applications
Under Applications, you can view:
-
Application Health – Provides an overview of applications that are in Down and Out-of-Service, and based on their status such as Critical, In Review, Good, and Not Applicable. Click View All Applications to view details in App Dashboard.
-
Golden Signal Anomalies – Provides an overview of applications that have server errors and response time anomalies. Click View Details for more information.
-
Application Config Optimization – Provides an overview of total applications that have performance issues. Click See More to view issue details in app dashboard.
-
SSL Certificates – Provides an overview of SSL certificates along with their validity. Click Manage SSL Certificates to view more information in SSL dashboard.
-
Application SSL Config Optimization – Provides an overview of total applications that have SSL related issues. Click See More to view issue details.
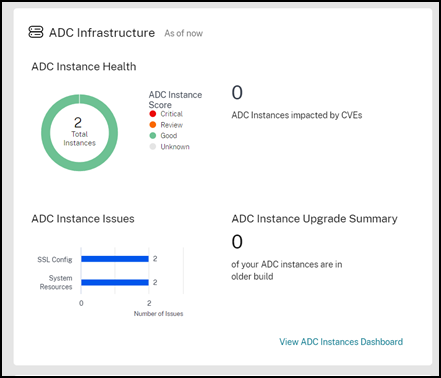
NetScaler Infrastructure
Under NetScaler Infrastructure, you can view the following NetScaler instance related key metrics:
-
NetScaler Instance Health – Provides an overview of total NetScaler instances based on the instance score.
-
NetScaler Instances impacted by CVEs – Provides an overview of total NetScaler instances that are impacted with Common Vulnerabilities and Exposures (CVEs). For more information, see Security Advisory.
-
NetScaler Instance Issues – Provides an overview of NetScaler instance issues depending upon the issue category. For more information, see Infrastructure Analytics.
-
NetScaler Instance Upgrade Summary – Provides an overview of total NetScaler instances that are not on the latest build. Click View NetScaler Instances Dashboard for more information.
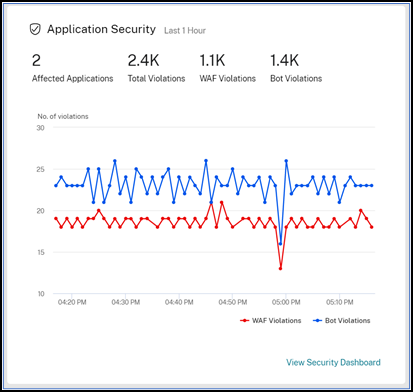
Application Security
Provides an overview of total affected applications and total violations (Bot and WAF) reported for the selected duration. Click View Security Dashboard to view the security and bot violation details.
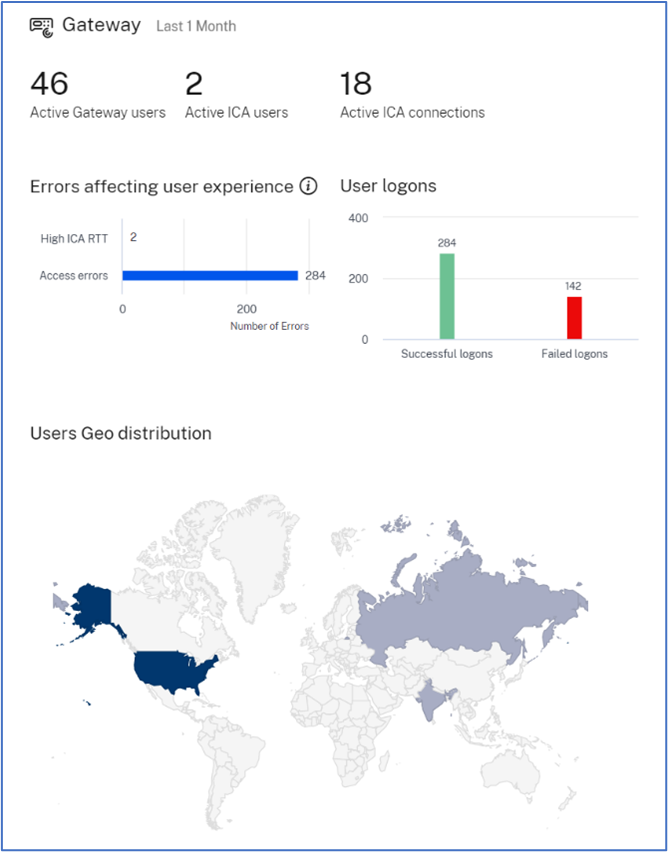
Gateway
Provides an overview of total active gateway users, total active ICA® users, and total active ICA connections. You can also view errors, user logon details, and a geo map that provides details on the user locations.
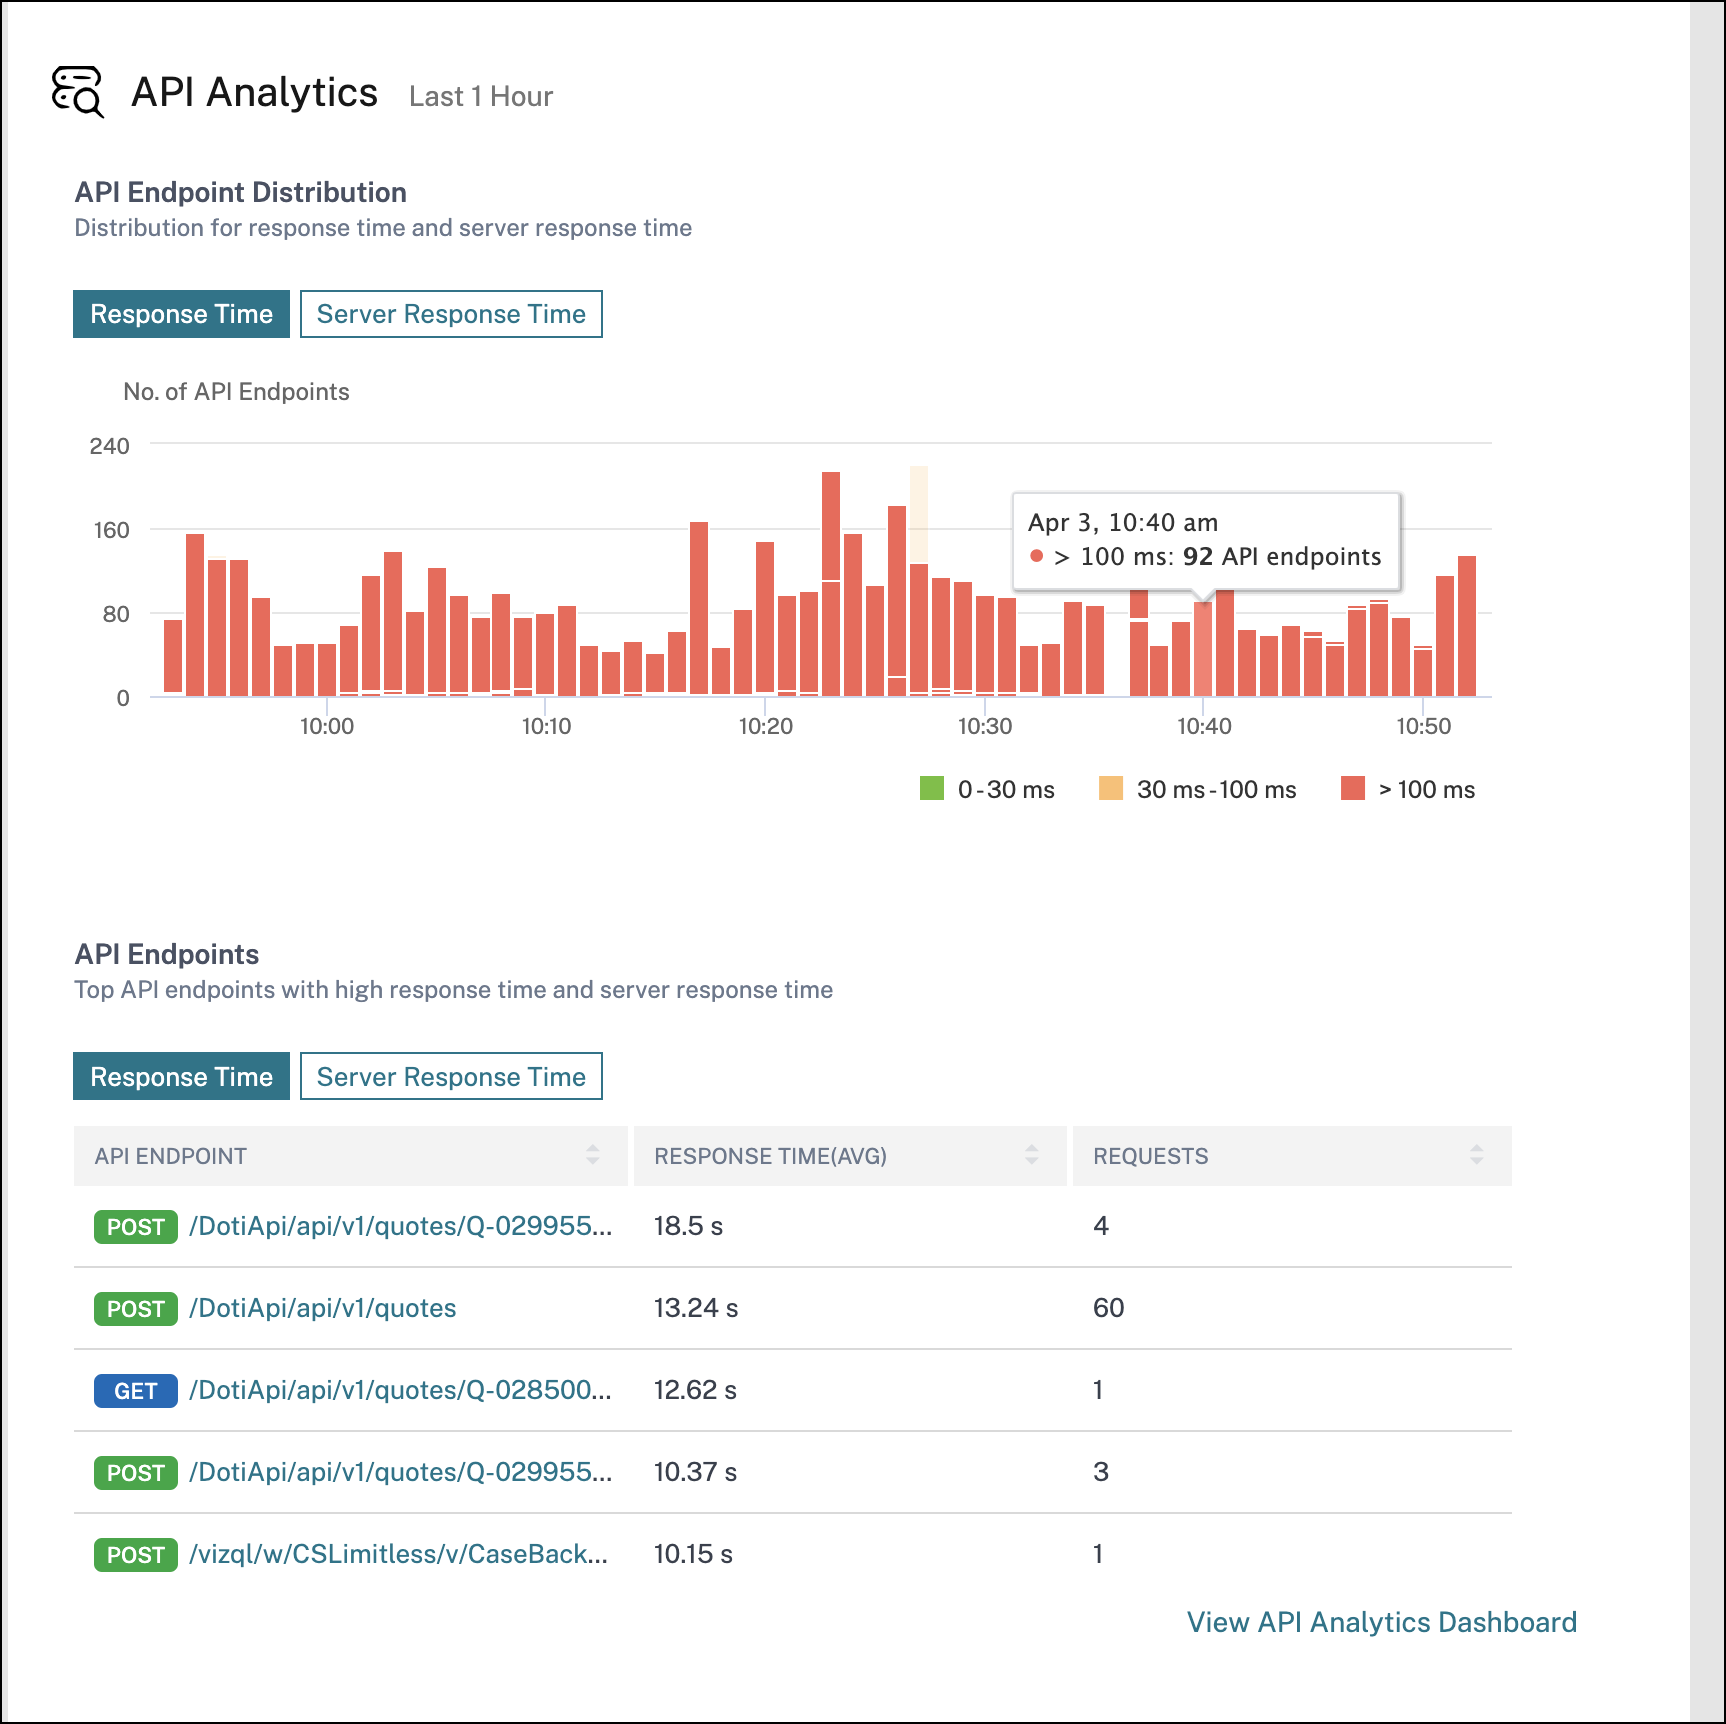
API Analytics
Provides an overview of the performance and usage of the API endpoints configured through NetScaler Console. You can view the:
-
Distribution of application and server response time for API endpoints.
-
Endpoints with high application and server response time.
Customize dashboard
You can use the Edit dashboard option and customize the dashboard view based on your choice. Using the Edit dashboard option, you can:
-
Drag widgets
-
Remove the whole widget (Applications, NetScaler Infrastructure, Gateway, or Application Security).
-
Remove the smaller widgets present under each widget.
-
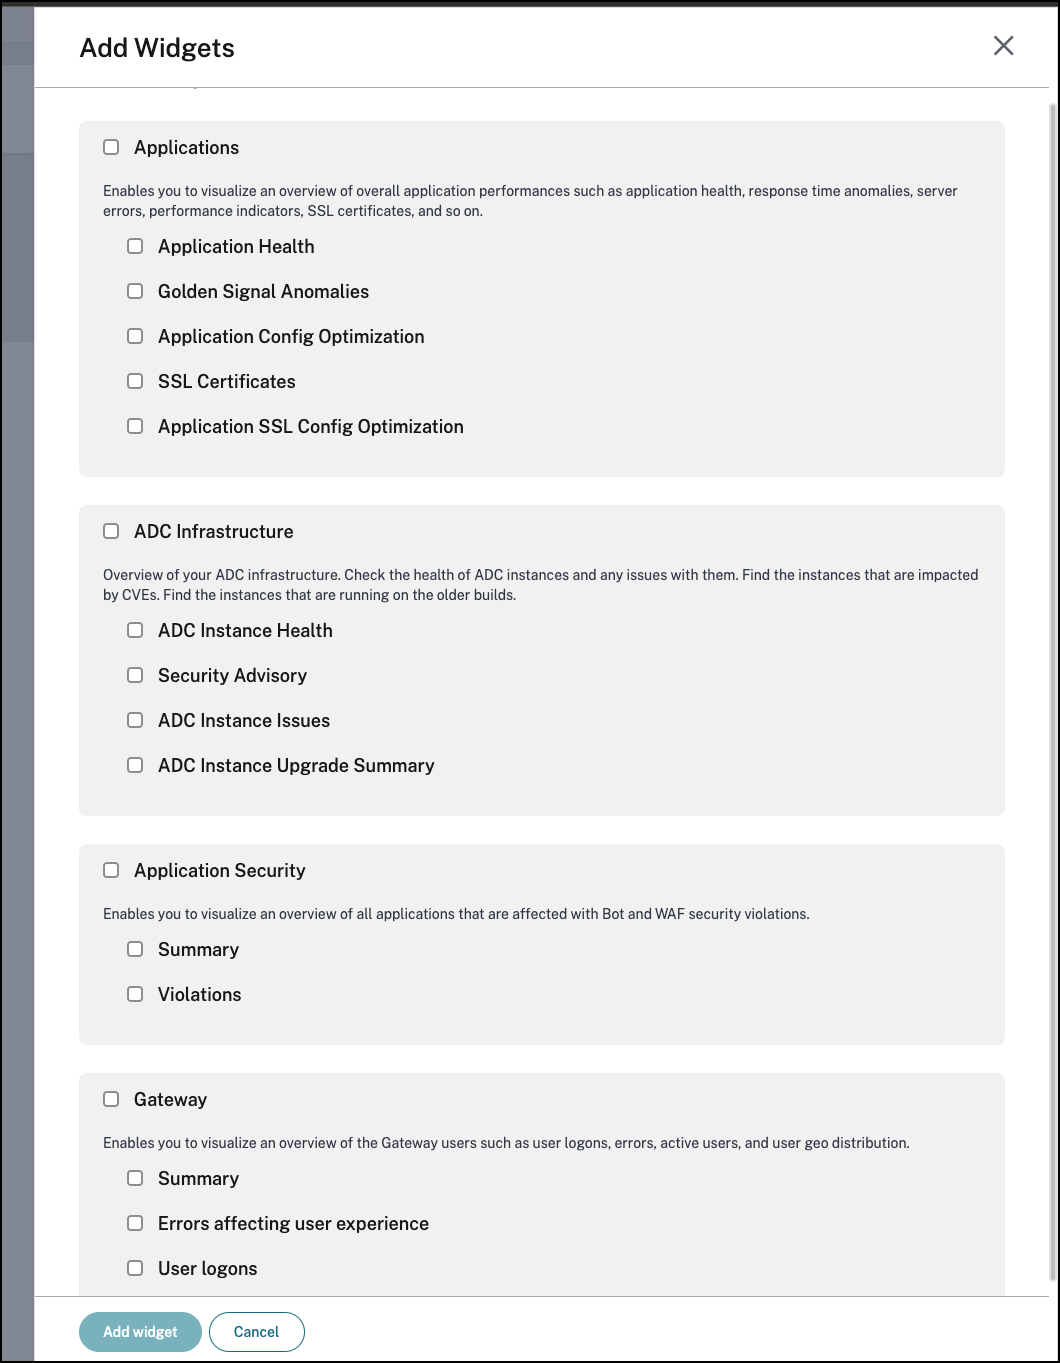
Click Add widget and select the required key metrics that you want to view under each widget.
-
Reset to default
-
Reset to last saved
After making changes, click Save.
Note
By default, all widgets are displayed. If you customize the dashboard, save the changes, and again use the Reset to default option, all widgets get added to the dashboard.
The Reset to last saved option loads the previously saved configuration.
View agent details
In the unified dashboard, you can visualize an overview of agent details. In Overview > Dashboard, next to the Agent Status, you can view the following status that enables you to analyze the overall agent availability:
-
All available. Indicates all agents are up and running.
-
All unavailable. Indicates all agents are down and not accessible.
-
[number of agents] unavailable. Indicates a few agents are down and not accessible.
-
All out of service. Indicates all agents are in out of service.
-
[number of agents] out of service. Indicates a few agents are in out of service.
-
External agent not found. Indicates no agent (through any hypervisors) is configured.
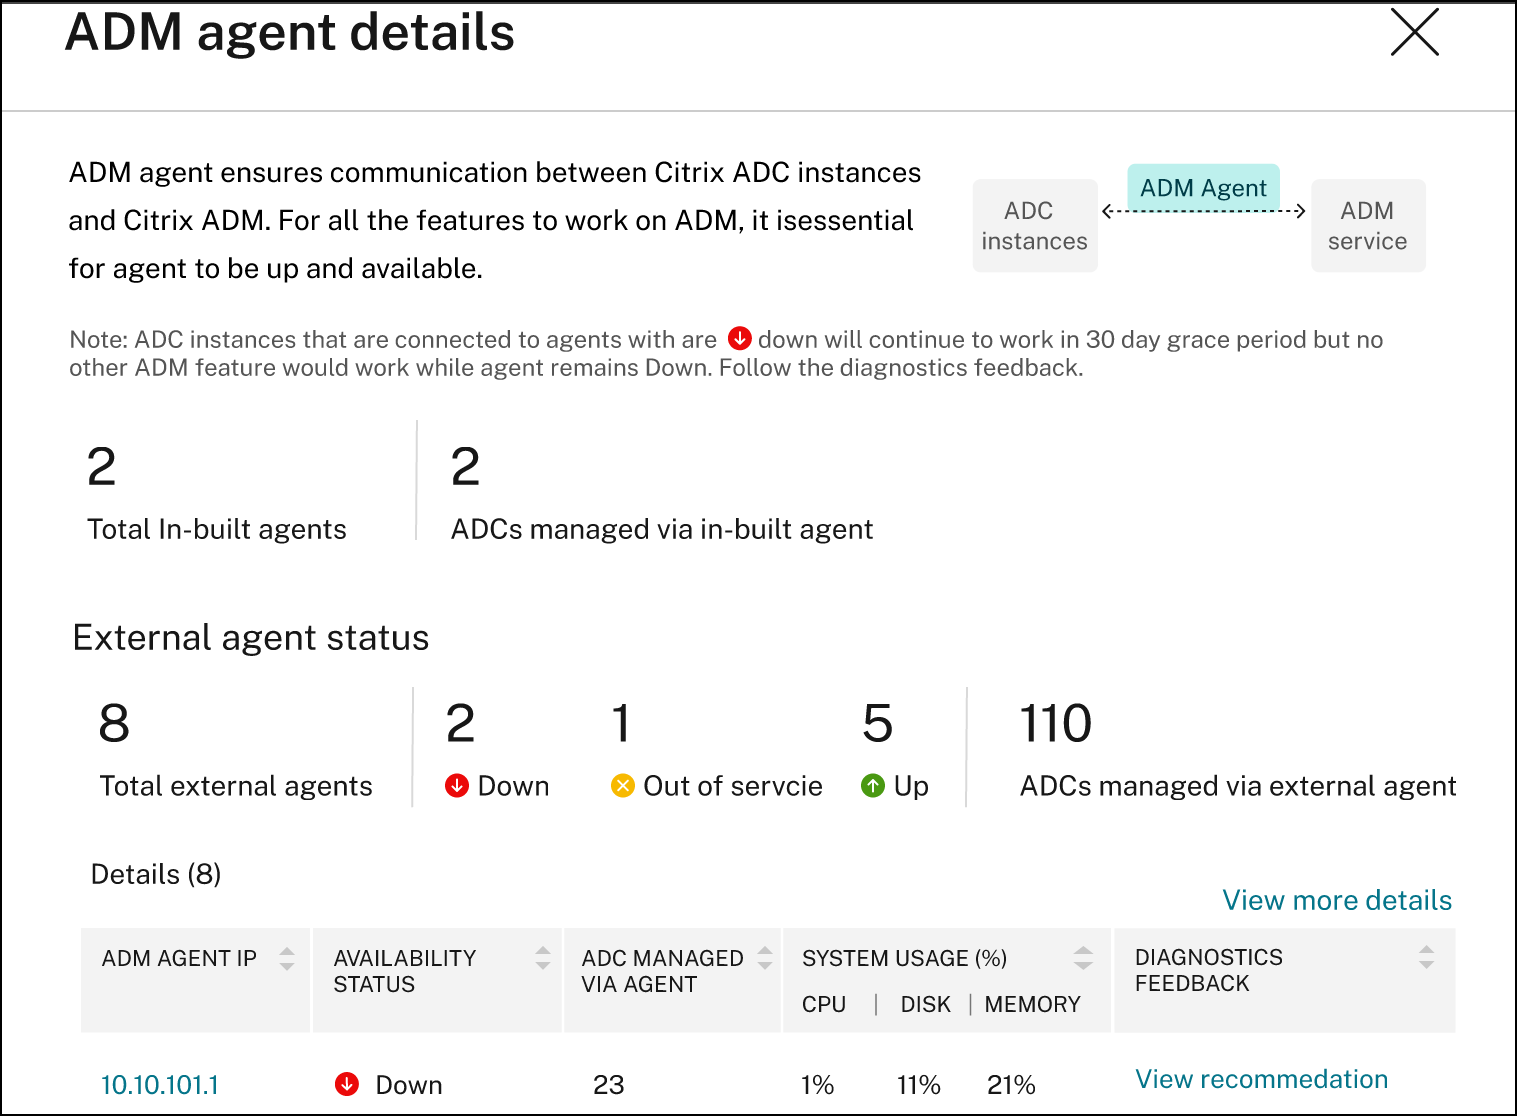
Click View Details to visualize an overview of agent details such as total in-built agents, total external agents, agent IP, status, system usage, diagnostic checks, and so on.
Create and apply filters
You can apply filters and view insights only for the selected instances or applications in the following:
-
Applications
-
NetScaler Infrastructure
-
Application Security
By default, all applications are selected. You can create a customized filer from the dashboard by clicking the filters icon available in the tile.
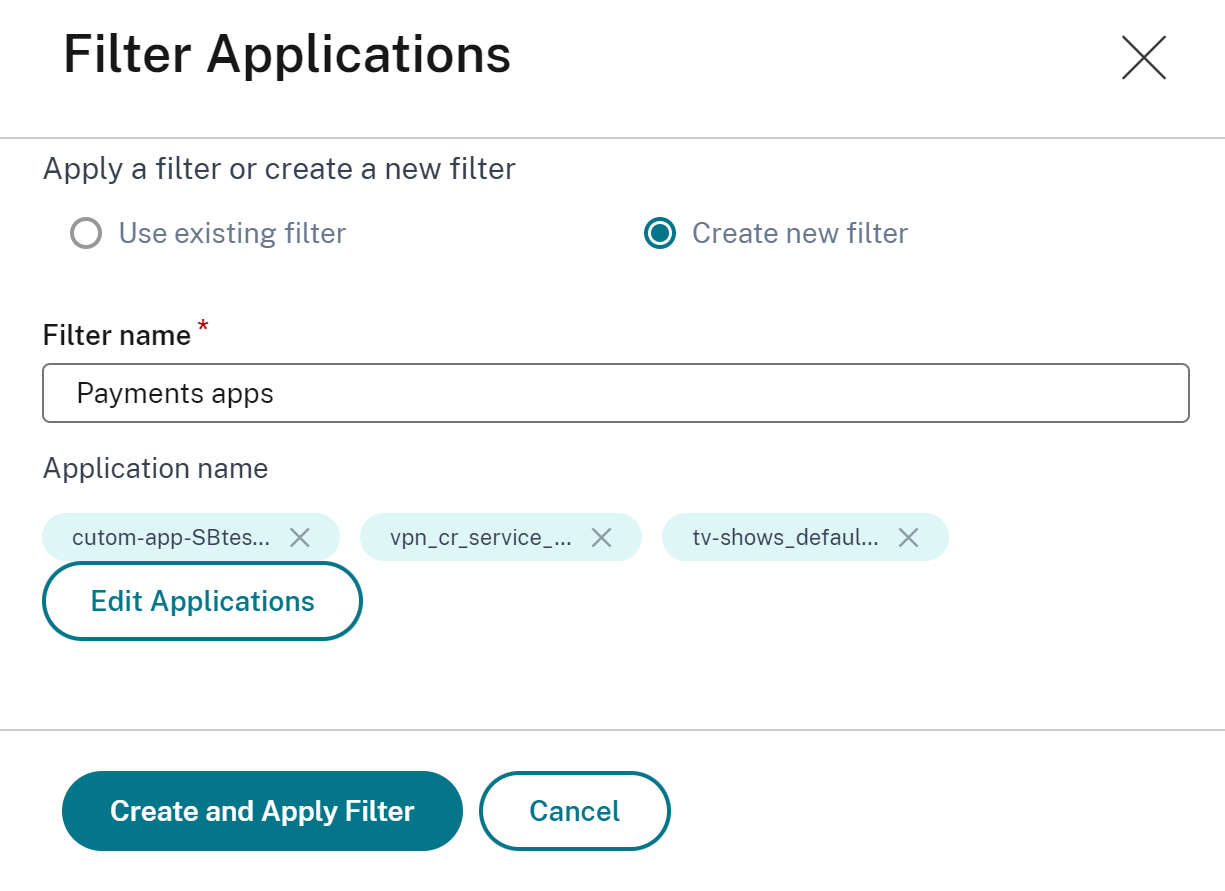
In the Filter Applications window:
-
Select Create new filter.
-
Provide a filter name based on your choice.
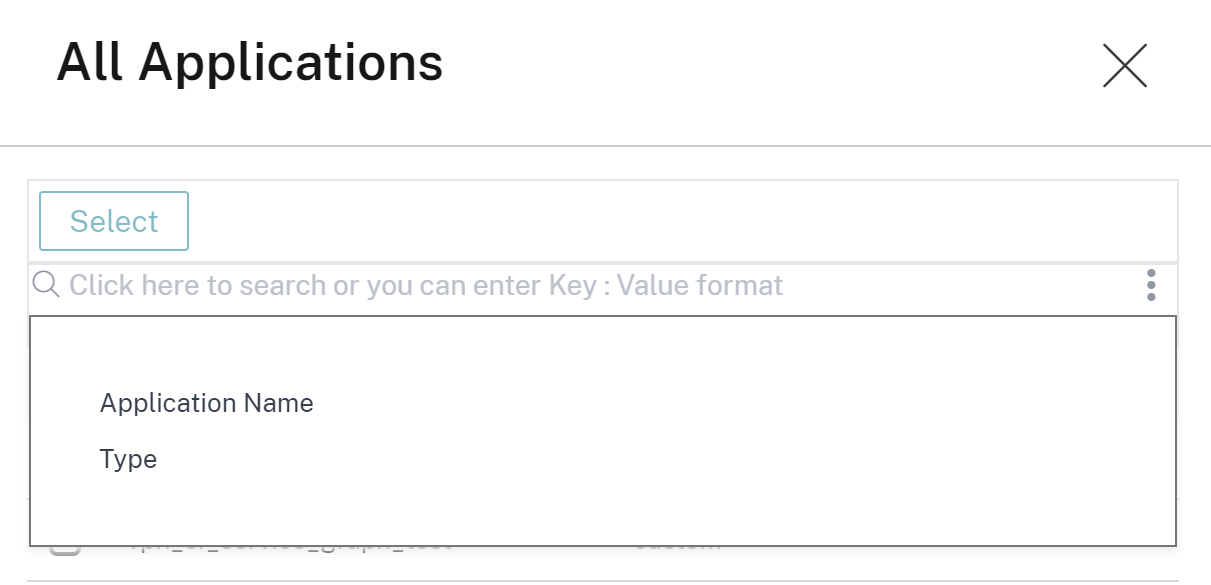
-
Click Select Applications and add all the required applications for the filter. When you select applications, you can also use the filters (Application Name and Type) and then select applications.
-
Click Create and Apply filter.
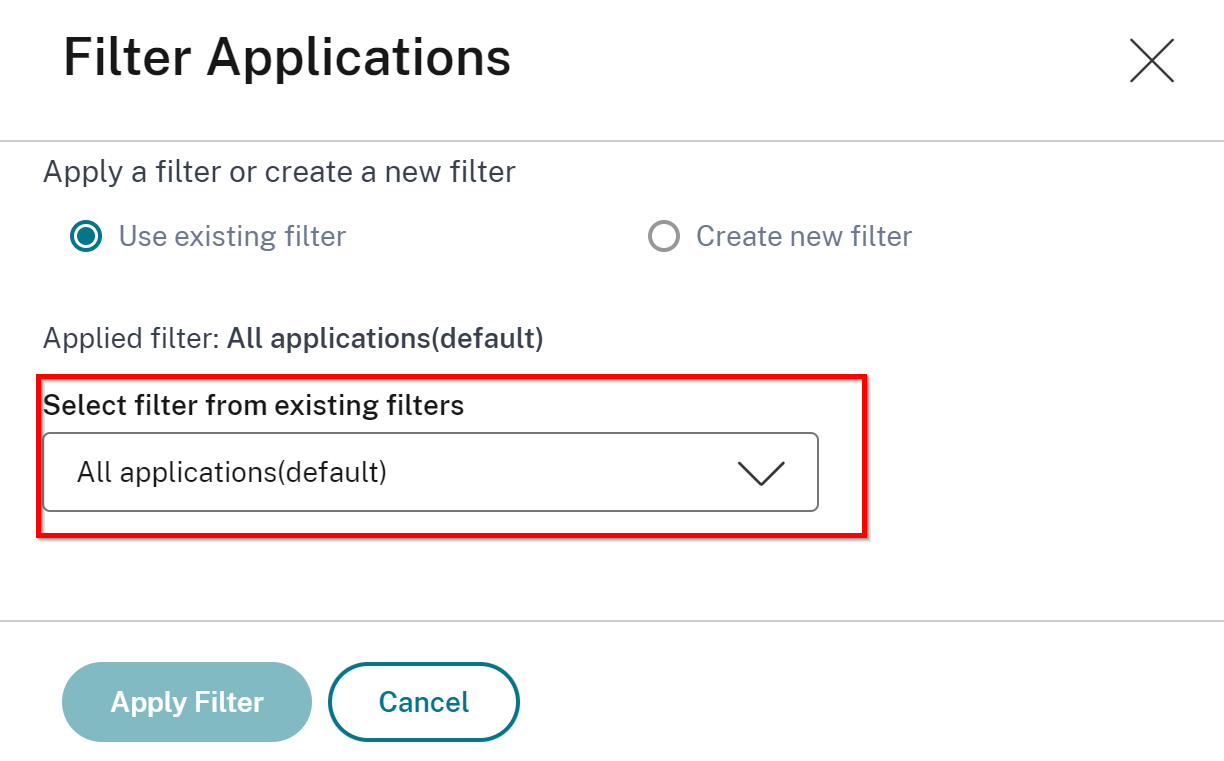
The filter is now created and applied. You can create more filters by following the same procedure. After you create filters, you can select and apply filters through the Select filter from existing filters list.
Edit filters
You can edit a filter by selecting the filter from the list and clicking Edit. Using the edit option, you can add or remove applications and then update the filter.
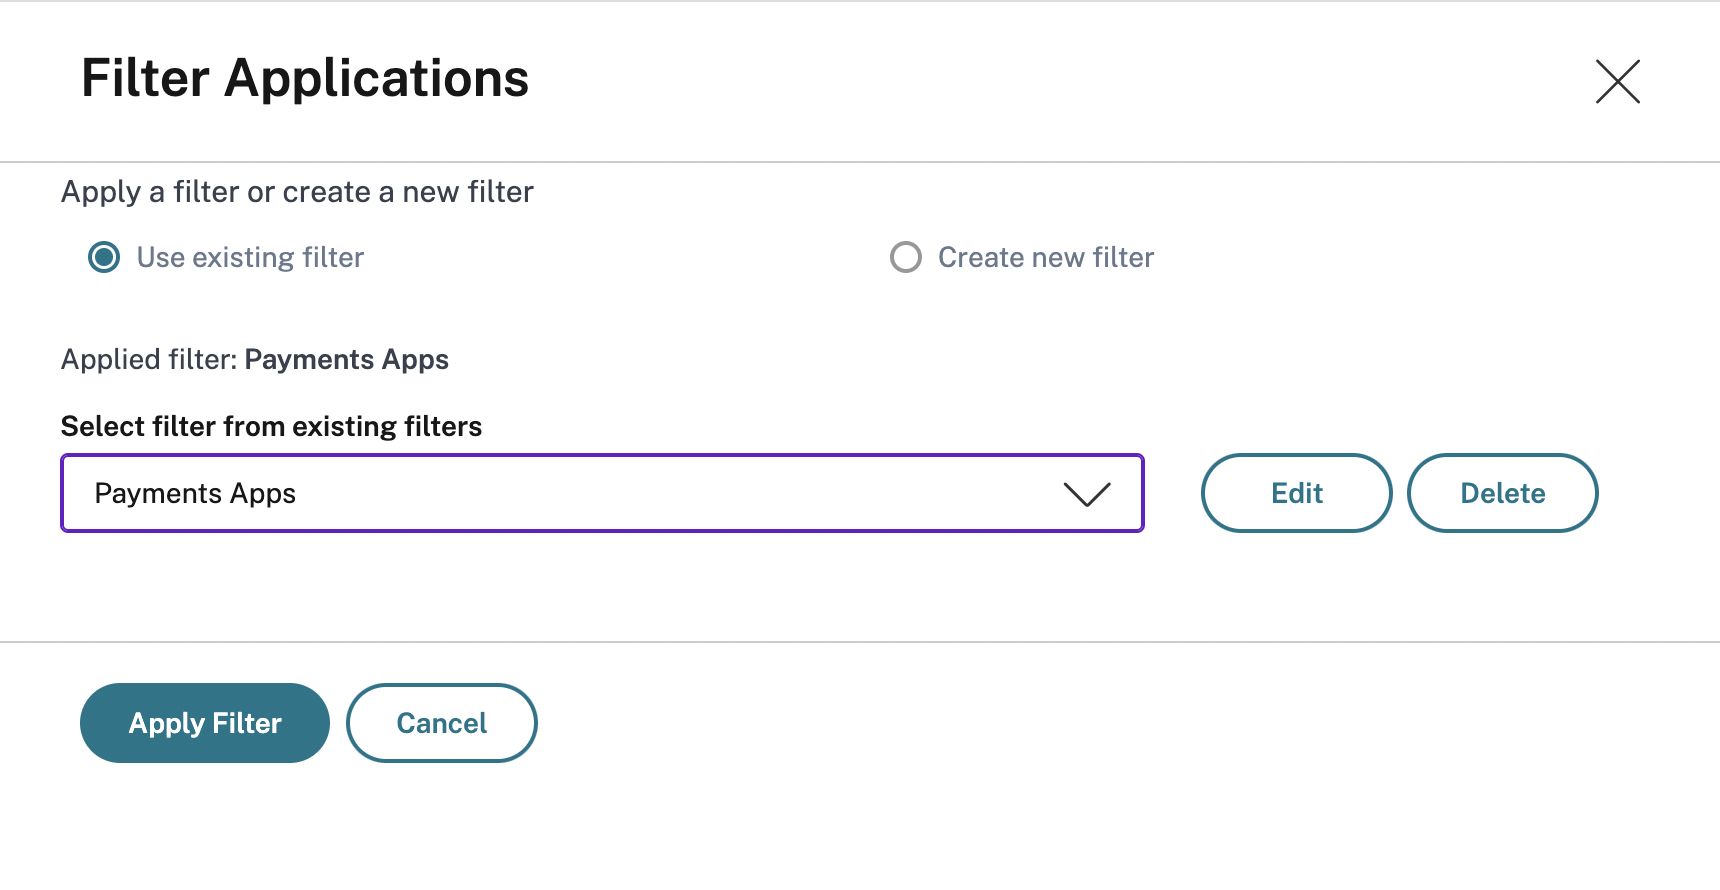
To delete a filter, select the filter from the list and click Delete.
Note
When you create a filter with applications and if one of the applications is deleted in the app dashboard, the application details are removed immediately from the unified dashboard.
Share
Share
This Preview product documentation is Cloud Software Group Confidential.
You agree to hold this documentation confidential pursuant to the terms of your Cloud Software Group Beta/Tech Preview Agreement.
The development, release and timing of any features or functionality described in the Preview documentation remains at our sole discretion and are subject to change without notice or consultation.
The documentation is for informational purposes only and is not a commitment, promise or legal obligation to deliver any material, code or functionality and should not be relied upon in making Cloud Software Group product purchase decisions.
If you do not agree, select I DO NOT AGREE to exit.