Diagnostics for troubleshooting telemetry collection and upload issues
Prior to release 14.1 build 56.x, the diagnostics helps to examine the outbound connectivity to these endpoint URLs and lets you know if they are in reachable status. NetScaler On-prem release 14.1 build 56.x and later provides enhanced diagnostics to identify and troubleshoot telemetry collection and upload issues at both collector level (Console) and device level (individual NetScaler instances).
Diagnostic behaviour from release 14.1 build 56.x onwards
Note:
Starting from release 14.1 build 56.x,the telemetry diagnostics feature is enhanced to identify and troubleshoot telemetry collection and upload issues at both collector level (Console) and device level (individual NetScaler instances).
All managed NetScaler instances must send telemetry data to remain compliant. However, telemetry uploads and collection fails due to connectivity or configuration issues. The Diagnostics capability on the NetScaler telemetry page of Console on-prem helps you quickly identify and troubleshoot issues at both levels:
- Collector level (Console): To check whether the data was successfully uploaded.
- Device level (individual NetScaler instances): To check whether the data was collected from NetScaler instances.
How it works
The following are the high-level steps involved in the diagnostics process:
-
Automatic Run: Diagnostics run automatically every 24 hours.
-
On-Demand Runs: Users can run diagnostics manually as needed, especially after attempting to fix an issue.
-
Status Indicators: The results are displayed with clear statuses:
-
Success: No issues detected.
-
Needs Attention: One or more issues require user action.
-
Note:
Click View Details or on error-highlighted areas for in-depth error logs and mitigation steps.

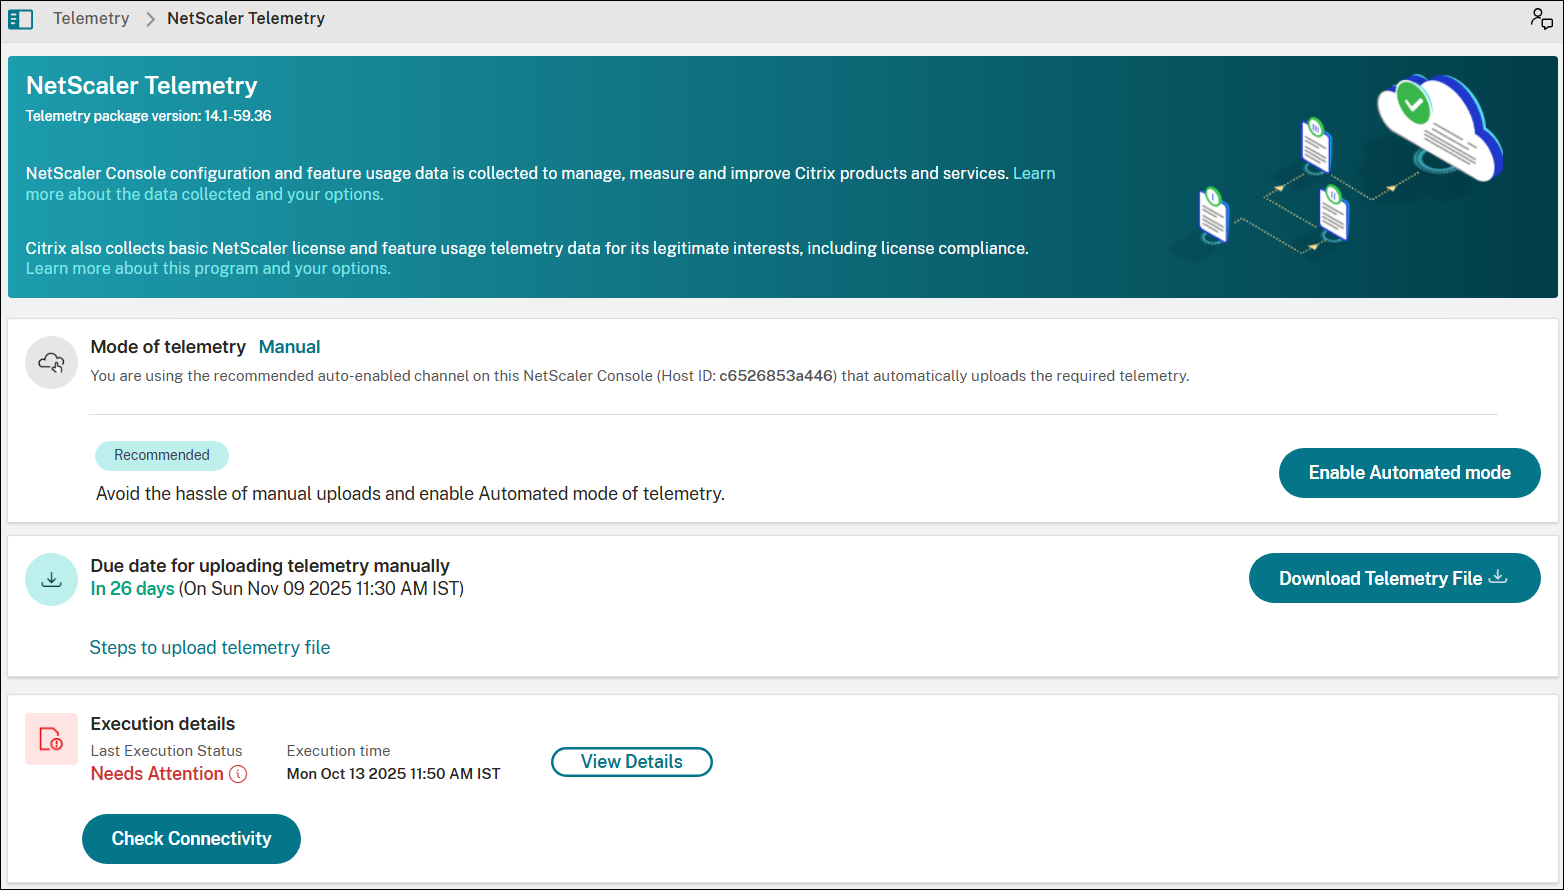
Collector level (Console) diagnostics
This section checks whether the NetScaler Console is successfully collecting data from managed devices and uploading it to the required destination.
| Check Field | Description |
|---|---|
| Execution Time | Timestamp of the last telemetry collection from managed NetScaler instances. |
| Package Version | The check identifies which telemetry package version is installed on Console on-prem, ensuring the latest set of data is collected. |
| Evergreen Download Status | (Auto-mode only) Console on-prem checks every 24 hours for updated telemetry script packages from the download service URL. Hover over the information (i) icon to see the specific cause of failure. To get more details on the mitigation steps, click the Failure status. |
| Connectivity Status
|
(Auto-mode only) Confirms that required URLs are whitelisted and reachable. Connection issues, for example, proxy misconfiguration block Console from reaching these URLs. Hover over the information (i) icon to see the specific cause of unreachability. To get more details on the mitigation steps, click the Unreachable status.
|
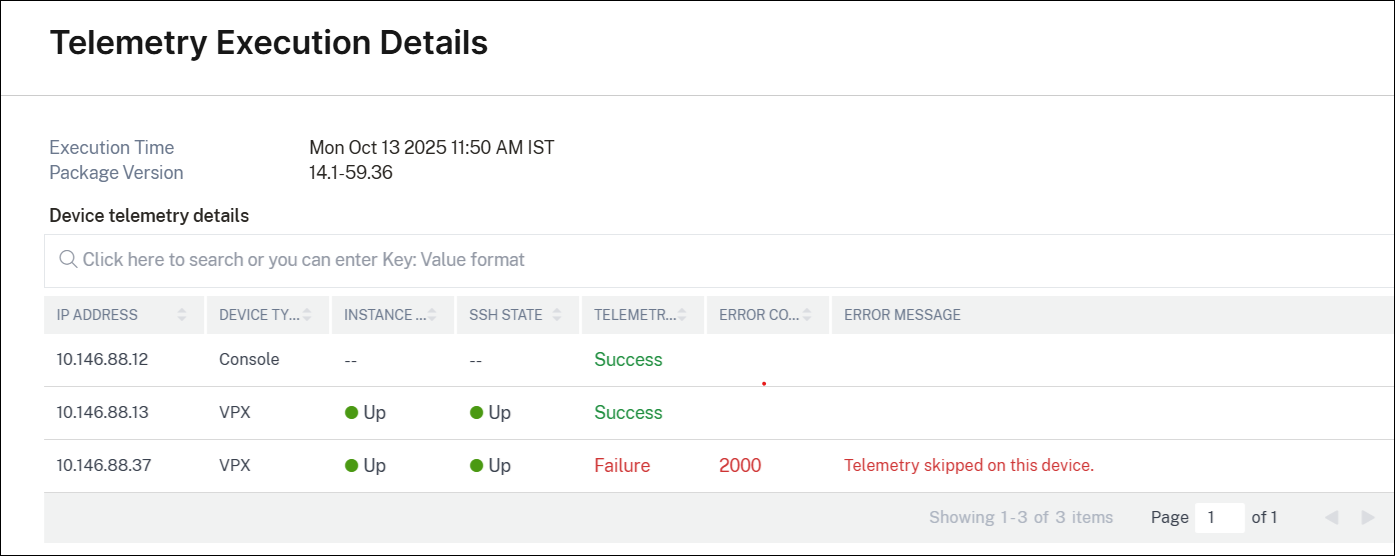
Device-Level (NetScaler) Diagnostics
The Console runs device-level diagnostics by pushing a telemetry collection script to each managed NetScaler instance, gathering the data, and preparing it for upload.
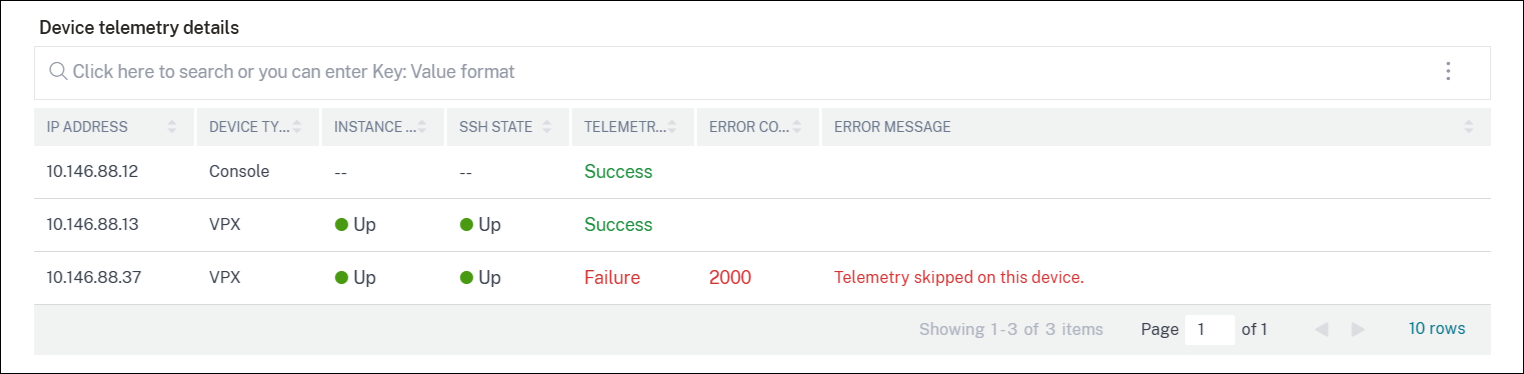
The Device Telemetry Details Table provides the results of this process, including:
-
Device details
-
Telemetry Status
-
Error codes and Error messages
For detailed error information and mitigation steps, click the red-highlighted error details.
Mitigation: Each error code is mapped to a recommended solution in the Mitigation Table. Follow the recommendation for fixing the issues.
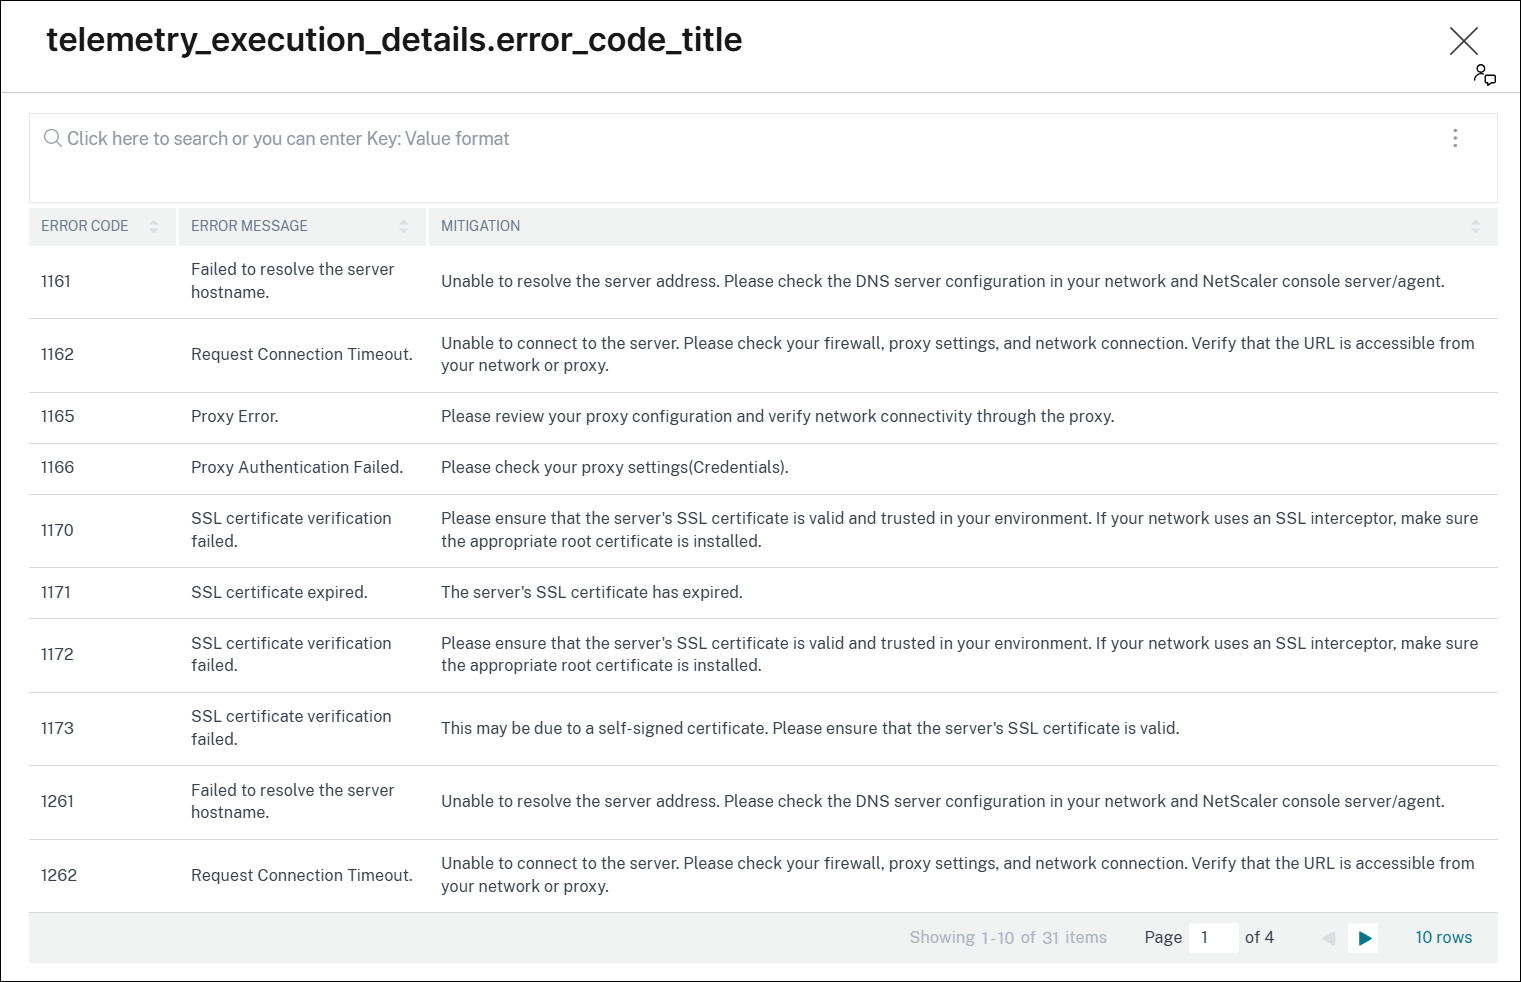
Error Table Mapping
| Error Code | Error Message | Customer Action |
|---|---|---|
| 1161 | Failed to resolve the server host name | Unable to resolve the server address. Please check the DNS server configuration in your network and NetScaler console server/agent. |
| 1162 | Unable to resolve the server address. Please check the DNS server configuration in your network and NetScaler console server/agent. | Unable to connect to the server. Please check your firewall, proxy settings, and network connection. Also, verify that the URL download.citrixnetworkapi.net is accessible from your network or through your proxy. |
| 1165 | Proxy Error | Please check your proxy configuration and ensure that network connectivity is working through the proxy. |
| 1166 | Proxy Authentication Failed | Please check your proxy credentials in the NetScaler console. |
| 1170 | SSL certificate verification failed. | If your network uses an SSL interceptor, make sure the appropriate root certificate is installed in the NetScaler console. |
| 1171 | SSL certificate expired | SSL certificate expired. |
| 1172 | SSL certificate verification failed. | If your network uses an SSL interceptor, make sure the appropriate root certificate is installed in the NetScaler console. |
| 1173 | SSL certificate verification failed. | This may be due to a self-signed certificate. If your network uses an SSL interceptor, make sure the appropriate root certificate is installed in the NetScaler console. |
| 1261 | Failed to resolve the server hostname | Unable to resolve the server address. Please check the DNS server configuration in your network and NetScaler console server/agent. |
| 1262 | Request Connection Timeout | Unable to connect to the server. Please check your firewall, proxy settings, and network connection. Verify that both URLs (download.citrixnetworkapi.net, safehaven.adm.cloud.com) are accessible from your network or through your proxy. |
| 1265 | Proxy Error | Please check your proxy configuration and ensure that network connectivity is working through the proxy. |
| 1266 | Proxy Authentication Failed. | Please check your proxy credentials in the NetScaler console. |
| 1270 | SSL certificate verification failed | If your network uses an SSL interceptor, make sure the appropriate root certificate is installed in the NetScaler console. |
| 1271 | SSL certificate expired. | The server’s SSL certificate has expired. |
| 1272 | SSL certificate verification failed | If your network uses an SSL interceptor, make sure the appropriate root certificate is installed in the NetScaler console. |
| 1273 | SSL certificate verification failed | This may be due to a self-signed certificate. If your network uses an SSL interceptor, make sure the appropriate root certificate is installed in the NetScaler console. |
| 1361 | Failed to resolve the server hostname | Unable to resolve the server address. Please check the DNS server configuration in your network and NetScaler console server/agent. |
| 1362 | Request Connection Timeout. | Unable to connect to the server. Please check your firewall, proxy settings, and network connection. Verify that the URL safehaven.adm.cloud.com is accessible from your network or through your proxy. |
| 1365 | Proxy Error | Please check your proxy configuration and ensure that network connectivity is working through the proxy. |
| 1366 | Proxy Authentication Failed | Please check your proxy credentials in the NetScaler console. |
| 1370 | SSL certificate verification failed. | If your network uses an SSL interceptor, make sure the appropriate root certificate is installed in the NetScaler console. |
| 1371 | SSL certificate expired | The server’s SSL certificate has expired. |
| 1372 | SSL certificate verification failed. | If your network uses an SSL interceptor, make sure the appropriate root certificate is installed in the NetScaler console. |
| 1373 | SSL certificate verification failed. | This may be due to a self-signed certificate. If your network uses an SSL interceptor, make sure the appropriate root certificate is installed in the NetScaler console. |
| 2000 | Telemetry skipped on this device. | This may be because this device is managed by another NetScaler Console/Service/Agent. Please ensure the other collector is sending telemetry data successfully. |
| 2100 | Instance state is down or not reachable. | Please ensure that the instance is running and reachable. |
| 2250 | SSH Authentication error | Please ensure that the device profile is properly configured in the NetScaler console for the device. |
| 2251 | SSH Connection timeout/refused. | The connection may be temporarily blocked by a firewall or network policy, or the device may be unreachable. Please verify network connectivity and ensure that the SSH port is accessible. |
| 2252 | Host key verification failed | Verify server identity with admin, then remove old key: ssh-keygen -R <server_address>. |
| 2350 | SSH Authentication error. | Please ensure that the device profile is properly configured in the NetScaler console for the device. |
| 2351 | SSH Failed to connect to device | The connection may be temporarily blocked by a firewall or network policy, or the device may be unreachable. Please verify network connectivity and ensure that the SSH port is accessible. |
Diagnostic behaviour before release 14.1 build 56.x
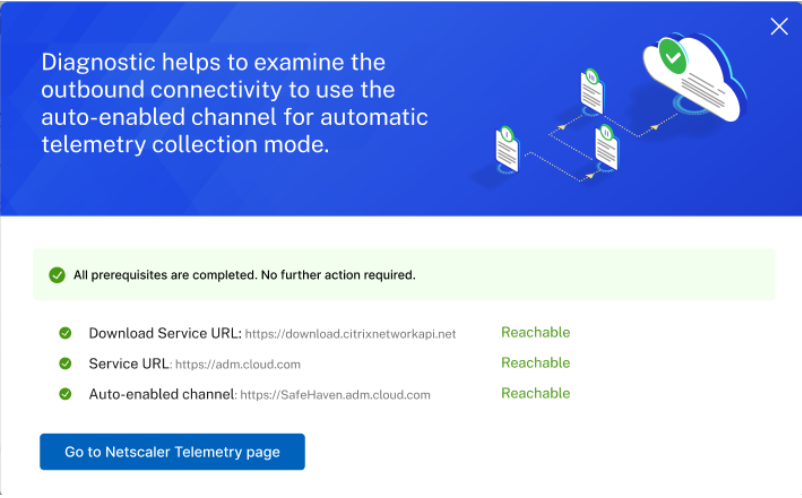
In release 14.1 build 51.x and earlier, the diagnostic helps to examine the outbound connectivity to these endpoint URLs and lets you know if they are in reachable status.
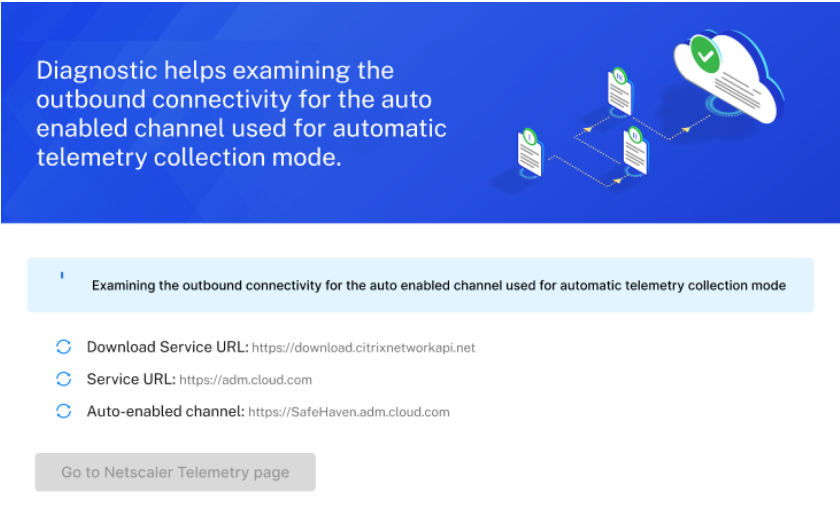
After you see the endpoint URLs in reachable status, click Go to NetScaler® Telemetry page.
If any prerequisites fail, the diagnostic check displays the endpoints that are not reachable and you must ensure that the URLs reachable. Click view pre-requisites to view details.
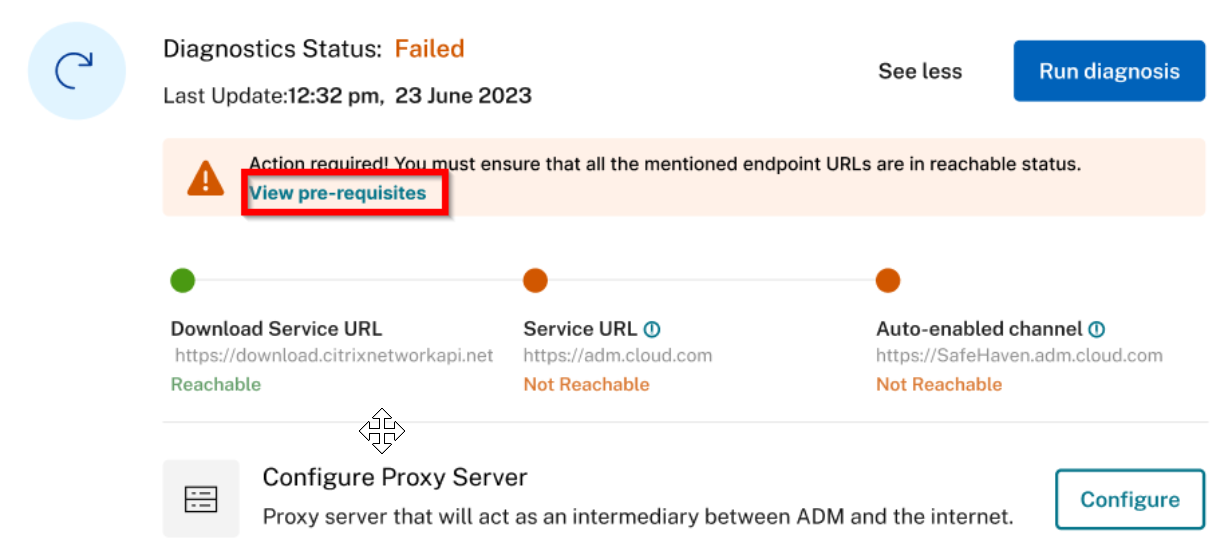
You can run diagnosis by clicking Run diagnosis to confirm if the endpoint URLs are reachable.
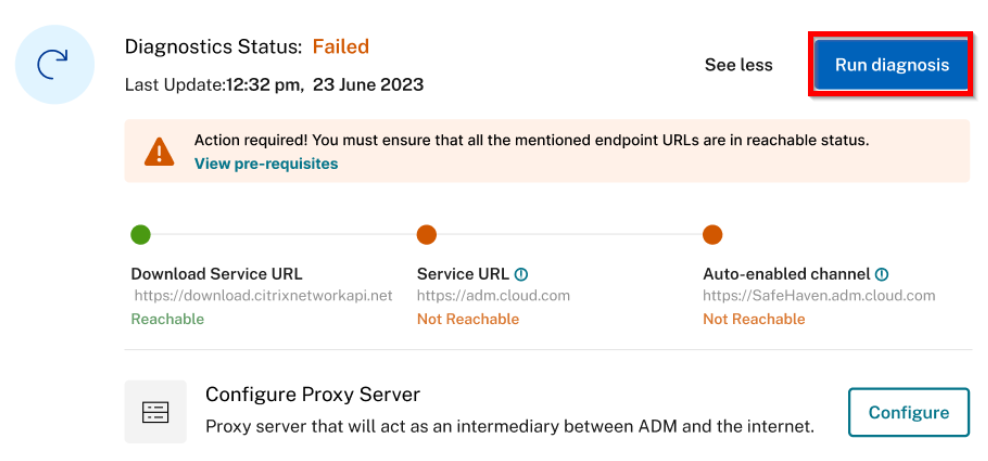
If no action is taken, your NetScaler Console on-prem might be non-compliant with the NetScaler telemetry program.
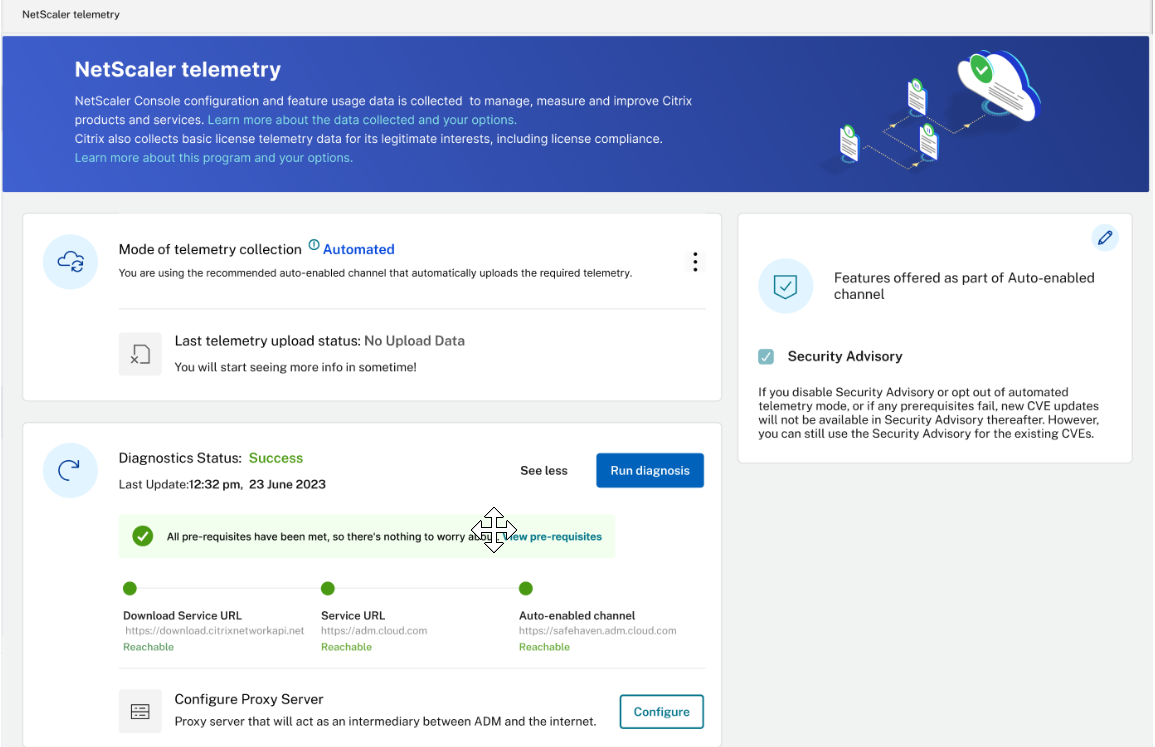
As part of the auto-enabled channel, you can use the Security Advisory feature with latest CVE updates in NetScaler Console on-prem. The Security Advisory feature enables you to identify the CVEs putting your NetScaler instances at risk and recommends remediations. You can view the latest CVE details that are impacting your NetScaler instances in Security Advisory. For more information, see Security Advisory.
Note:
You can also disable Security Advisory. If you disable Security Advisory, or opt-out of automated telemetry mode, or any prerequisites fail, the new CVE updates are not available and you can only use the Security Advisory with the existing or the last updated CVEs.
After the automated telemetry collection is enabled successfully, the first upload happens within 24 hours. The subsequent uploads happen every 24 hours automatically. The status changes to Success after the upload is complete.
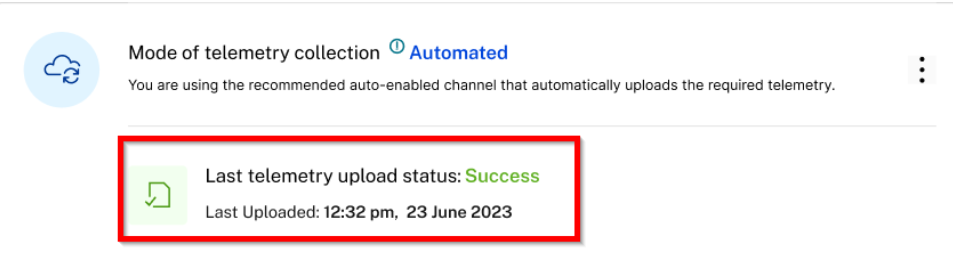
If the upload fails, ensure that the endpoint URLs are reachable. If the status indicates reachable and still the upload fails, contact Customer Care.
Notifications for telemetry uploads
By default, email notifications are enabled for telemetry uploads. The prerequisite to receive email notification is to configure an email distribution list. For more information, see Configure notification settings As an administrator, you receive email notifications for the following scenarios:
-
Telemetry collection failure - Email notifications are sent every 24 hours until the issue is resolved. The notification includes the NetScaler and Console IP addresses affected by the issue.
-
Upload failure through automated mode - Email notification is received every 24 hours until the issue is resolved.
-
Upcoming deadline for manual upload (only if enabled manual mode) - One email notification is received during the event and another email after the upload is complete.
-
Exceeded deadline for manual upload (only if enabled manual mode) - One email notification is received during the event and another email after the upload is complete.
Note:
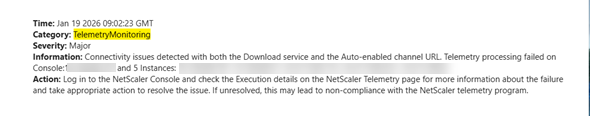
The notification for the telemetry collection issue on NetScaler devices also appears as a banner whenever a user logs in to the console user interface.
The following is an example of the email and banner notification for telemetry collection failure on NetScaler devices:
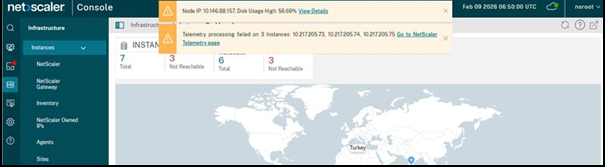
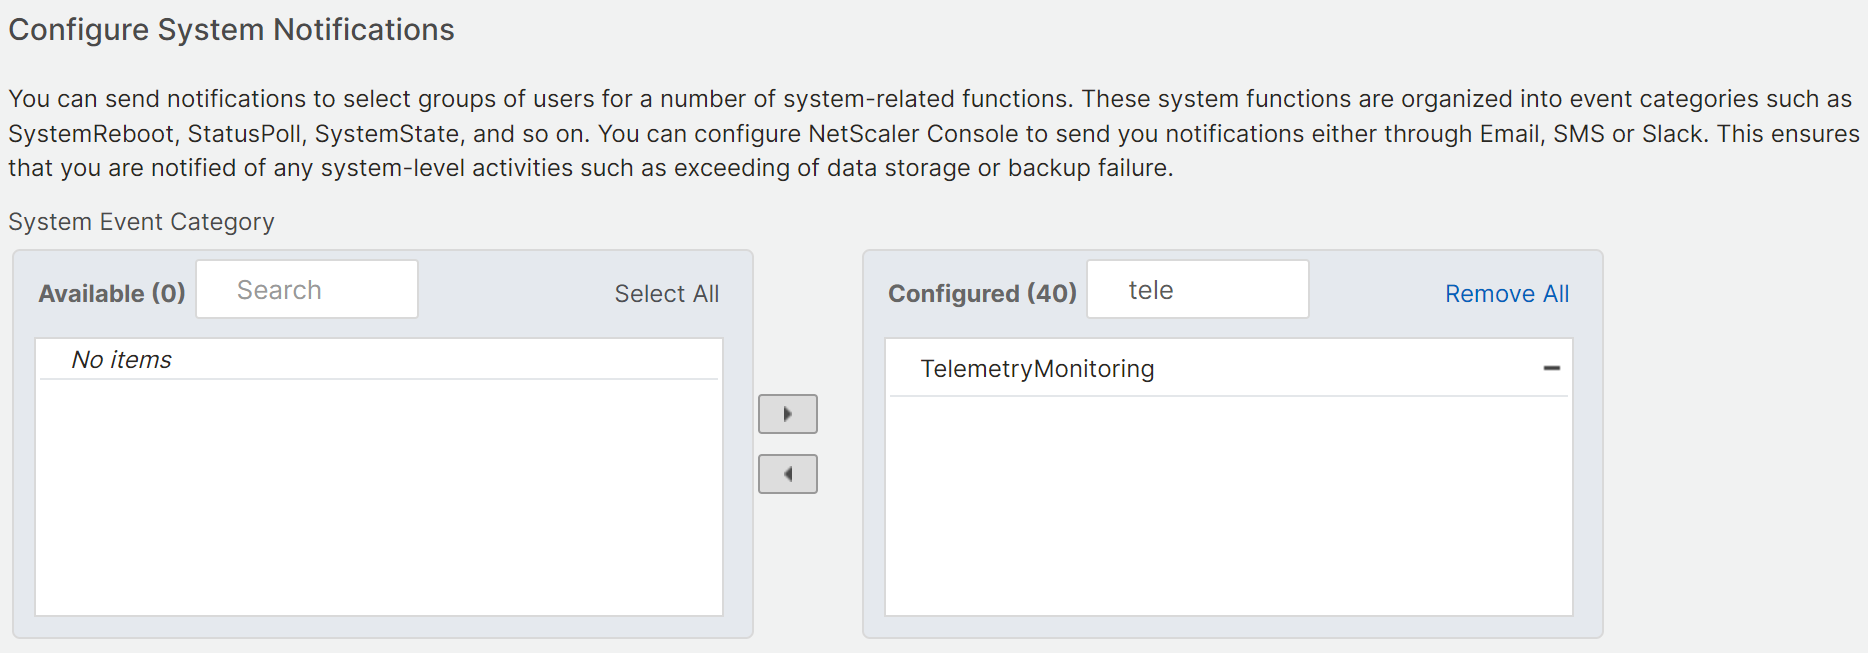
You can disable the email notification. To disable:
-
Navigate to Settings > Administration > Configure Event Notification and Digest.
-
In Event Notification > Configure System Notifications, search for TelemetryMonitoring, remove this notification, and click Save.