-
Low-touch onboarding of NetScaler instances using Console Advisory Connect
-
-
Console on-prem instances connected with Console service using Cloud Connect
-
Configure and view system alarms
-
This content has been machine translated dynamically.
Dieser Inhalt ist eine maschinelle Übersetzung, die dynamisch erstellt wurde. (Haftungsausschluss)
Cet article a été traduit automatiquement de manière dynamique. (Clause de non responsabilité)
Este artículo lo ha traducido una máquina de forma dinámica. (Aviso legal)
此内容已经过机器动态翻译。 放弃
このコンテンツは動的に機械翻訳されています。免責事項
이 콘텐츠는 동적으로 기계 번역되었습니다. 책임 부인
Este texto foi traduzido automaticamente. (Aviso legal)
Questo contenuto è stato tradotto dinamicamente con traduzione automatica.(Esclusione di responsabilità))
This article has been machine translated.
Dieser Artikel wurde maschinell übersetzt. (Haftungsausschluss)
Ce article a été traduit automatiquement. (Clause de non responsabilité)
Este artículo ha sido traducido automáticamente. (Aviso legal)
この記事は機械翻訳されています.免責事項
이 기사는 기계 번역되었습니다.책임 부인
Este artigo foi traduzido automaticamente.(Aviso legal)
这篇文章已经过机器翻译.放弃
Questo articolo è stato tradotto automaticamente.(Esclusione di responsabilità))
Translation failed!
Configure and view system alarms
You can enable and configure a set of alarms to monitor the health of your NetScaler Console servers. You must configure system alarms to make sure you are aware of any critical or major system issues.
For example, you might want to be notified if the CPU usage is high or if there are multiple login failures to the server. For some alarm categories, such as cpuUsageHigh or memoryUsageHigh, you can set thresholds and define the severity (such as Critical or Major) for each. For some categories, such as inventoryFailed or loginFailure, you can define only the severity. When the threshold is breached for an alarm category (for example, memoryUsageHigh) or when an event occurs corresponding to the alarm category (for example, loginFailure), a message is recorded in the system and you can view the message as syslog message. You can further set notifications to receive an email or SMS corresponding to your alarm settings.
You can assign or modify the severity of an alarm. The severity levels that you can assign are Critical, Major, Minor, Warning, and Informational.
Configure an alarm
Consider a scenario where you want to monitor a failed backup attempt. You can enable the backupFailed alarm and assign a severity, such as Major, to it. Whenever NetScaler Console attempts to back up the system files and when the attempt fails, an alarm is triggered. You can view the message on the NetScaler Console log messages page or get notifications through email or SMS.
To configure the alarm, you must select the backupFailed alarm and specify the severity level as Major. The alarm is enabled by default.
To configure and view a system alarm by using NetScaler Console:
-
Navigate to Settings > SNMP. Click Alarms in the upper-right corner.

-
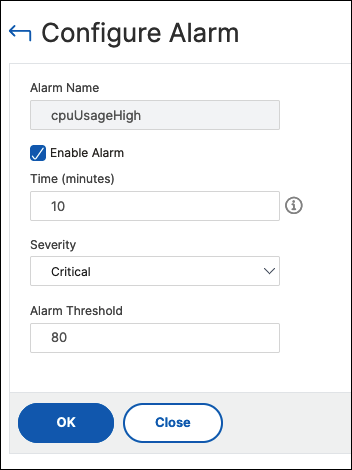
Select the alarm you want to configure (for example, cpuUsageHigh) and click Edit to modify its settings.

-
In the Configure Alarm page, select Enable Alarm to create alerts and then specify the following:
-
Time. Type the time (in minutes) after which you want to trigger the alarm.
-
Severity. Select the severity level.
-
Alarm Threshold. Enter the value for which the alarm should be triggered and alerts sent to you.
Click OK.
-
Note:
You cannot set the threshold for some alarms, for example, backupFailed. When the alarm is triggered, you can view the generated event as a syslog message.
To view the event generated by alarm (for example, backupFailed):
-
Navigate to Settings > Audit Log Messages.
-
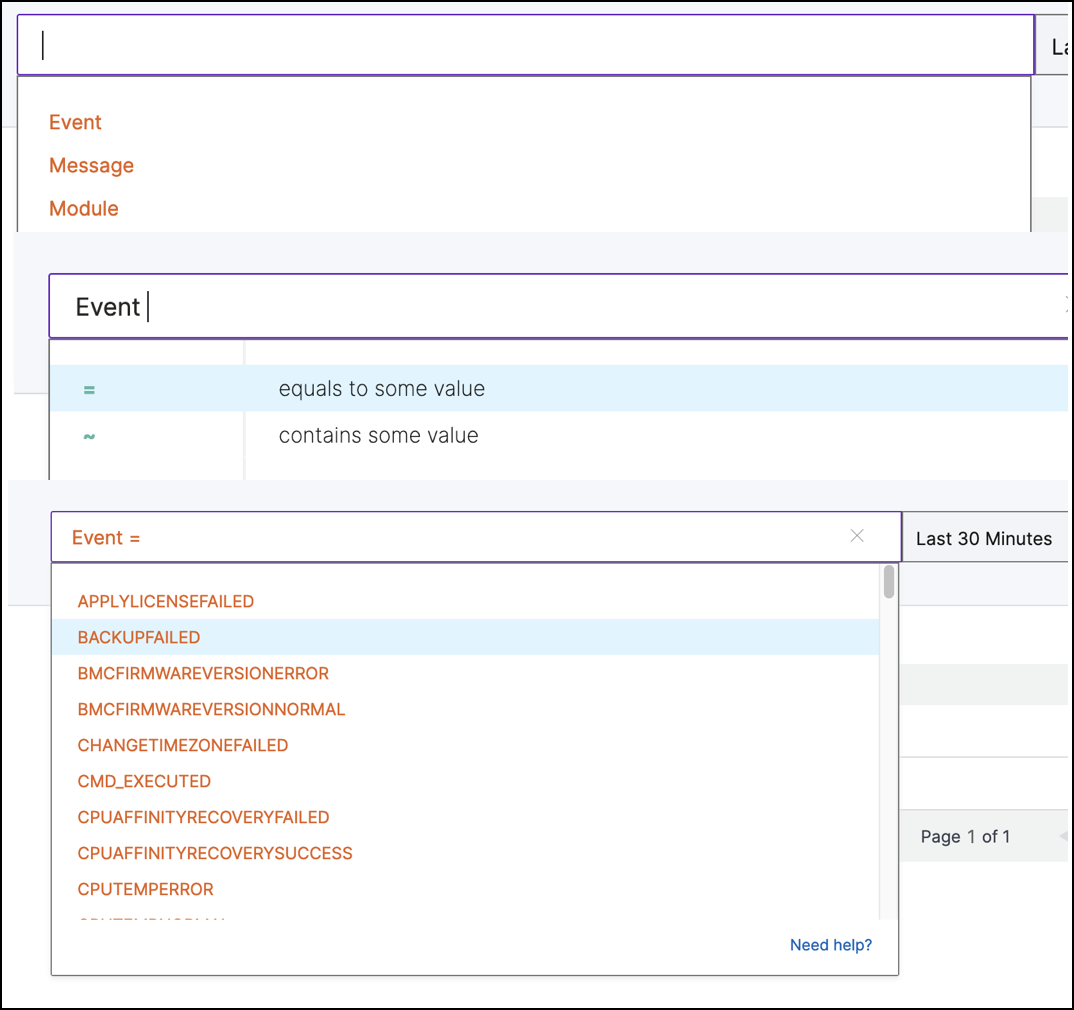
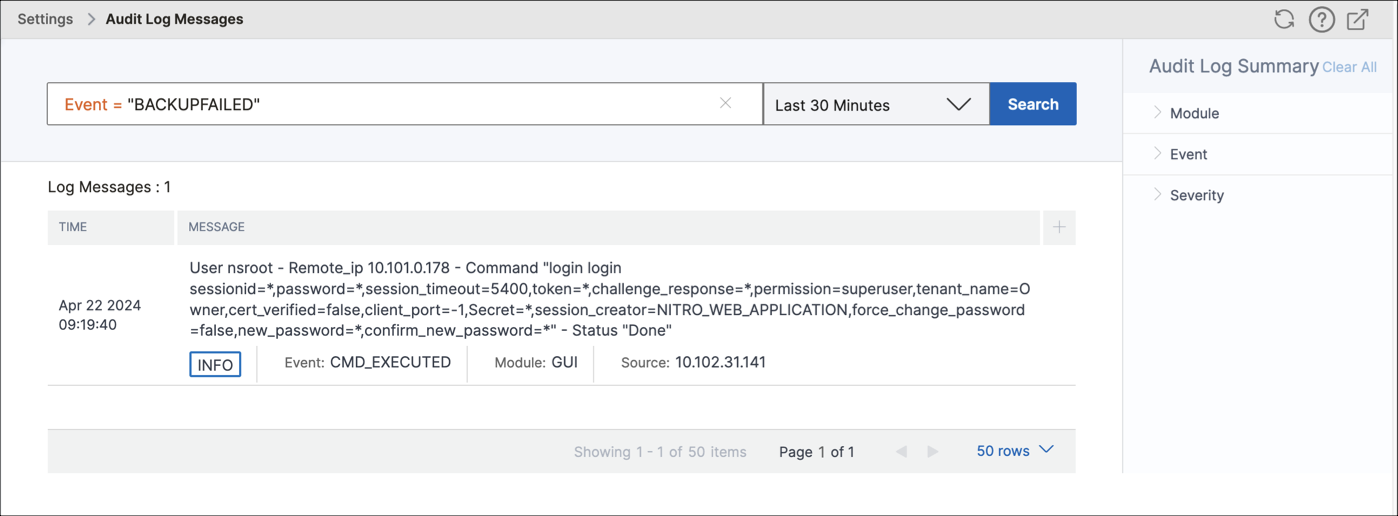
In the search field, select the type of alarm. In this example, select Event, = (equals to some value) and then BACKUPFAILED.

The event generated for a failed backup is displayed.

You can also set notifications to receive either an email or an SMS (Short Message Service) text when an alarm is triggered.
Add threshold limits to disk utilization alarms
Disk utilization alarms are triggered when the amount of disk space used on the NetScaler Console server exceeds a predefined threshold.
As an admin, when you receive alerts, you can choose to delete unnecessary data or allocate additional storage resources to prevent service disruptions or performance degradation.
Starting from release 14.1 build 25x, you can also add a lower-level threshold for disk utilization alarms. With this threshold value, you can set a lower-level limit to receive alerts before an upper threshold limit is breached.
To configure a lower-level threshold:
-
Navigate to Settings > SNMP > Alarms and in the search field, enter diskUtilizationHigh to view the disk utilization alarms.
-
Select the alarm and click Edit.
-
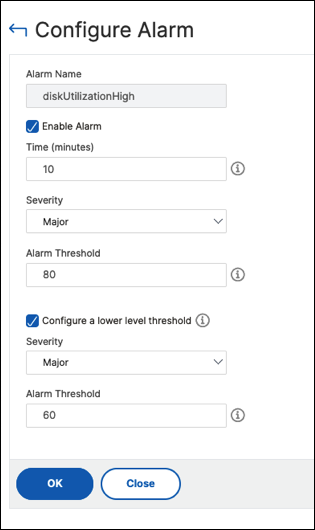
In the Configure Alarm page, select Configure a lower-level threshold. Enter the lower-level threshold limit.

For example, if you set a lower disk utilization threshold of 60 and an upper threshold of 80, you receive an alert when the disk usage exceeds 60% of the disk capacity. This setting allows you to take corrective actions before the disk utilization reaches 80%.
Share
Share
In this article
This Preview product documentation is Cloud Software Group Confidential.
You agree to hold this documentation confidential pursuant to the terms of your Cloud Software Group Beta/Tech Preview Agreement.
The development, release and timing of any features or functionality described in the Preview documentation remains at our sole discretion and are subject to change without notice or consultation.
The documentation is for informational purposes only and is not a commitment, promise or legal obligation to deliver any material, code or functionality and should not be relied upon in making Cloud Software Group product purchase decisions.
If you do not agree, select I DO NOT AGREE to exit.