-
-
-
-
Scenarios for Flexed or Pooled license expiry and connectivity issues behavior
-
Configure NetScaler Console as the Flexed or Pooled license server
This content has been machine translated dynamically.
Dieser Inhalt ist eine maschinelle Übersetzung, die dynamisch erstellt wurde. (Haftungsausschluss)
Cet article a été traduit automatiquement de manière dynamique. (Clause de non responsabilité)
Este artículo lo ha traducido una máquina de forma dinámica. (Aviso legal)
此内容已经过机器动态翻译。 放弃
このコンテンツは動的に機械翻訳されています。免責事項
이 콘텐츠는 동적으로 기계 번역되었습니다. 책임 부인
Este texto foi traduzido automaticamente. (Aviso legal)
Questo contenuto è stato tradotto dinamicamente con traduzione automatica.(Esclusione di responsabilità))
This article has been machine translated.
Dieser Artikel wurde maschinell übersetzt. (Haftungsausschluss)
Ce article a été traduit automatiquement. (Clause de non responsabilité)
Este artículo ha sido traducido automáticamente. (Aviso legal)
この記事は機械翻訳されています.免責事項
이 기사는 기계 번역되었습니다.책임 부인
Este artigo foi traduzido automaticamente.(Aviso legal)
这篇文章已经过机器翻译.放弃
Questo articolo è stato tradotto automaticamente.(Esclusione di responsabilità))
Translation failed!
HDX™ Insight
HDX Insight provides end-to-end visibility for HDX traffic to Citrix Virtual Apps and Desktop passing through NetScaler. It also enables administrators to view real-time client and network latency metrics, historical reports, End-to-end performance data, and troubleshoot performance issues. Availability of both real-time and historical visibility data enables NetScaler Console to support a wide variety of use cases.
For any data to appear you need to enable AppFlow on your NetScaler Gateway virtual servers. AppFlow can be delivered by the IPFIX protocol or the LogStream method.
Note
To allow ICA® round trip time calculations to be logged, enable the following policy settings:
-
ICA Round Trip Calculation
-
ICA Round Trip Calculation Interval
-
ICA Round Trip Calculation for Idle Connections
If you click an individual user, you can see each HDX session, active or terminated, that the user made within the selected time frame. Other information includes several latency statistics and bandwidth consumed during the session. You can also get bandwidth information from individual virtual channels such as audio, printer mapping, and client drive mapping.
Note
When you create a group, you can assign roles to the group, provide application-level access to the group, and assign users to the group. NetScaler Console analytics now supports virtual IP address based authorization. Your users can now see reports for all Insights for only the applications (virtual servers) that they are authorized to. For more information on groups and assigning users to the group, see Configure Groups.
You can also navigate to Gateway > HDX Insight > Applications and click Launch Duration to view the time taken for the application to launch. You can also view the user agent of all connected users by navigating to Gateway > HDX Insight > Users.
Note HDX insight supports Admin Partitions configured in NetScaler instances running on software version 12.0.
The following Thin Clients support HDX Insight:
-
WYSE Windows-based Thin Clients
-
WYSE Linux-based Thin Clients
-
WYSE ThinOS-based Thin Clients
-
10ZiG Ubuntu-based Thin Clients
Identifying the root cause of slow performance issues
Scenario 1
User is experiencing delays while accessing Citrix Virtual Apps and Desktops.
The delays might be due to latency on the server network, ICA traffic delays caused by the server network, or latency on the client network.
To identify the root cause of the issue, analyze the following metrics:
-
WAN Latency
-
DC Latency
-
Host Delay
To view the client metrics:
-
Navigate to Gateway > HDX Insight> Users.
-
Scroll down and select the user name and select the period from the list. The period can be one day, one week, one month, or you can even customize the period for which you want to see the data.
-
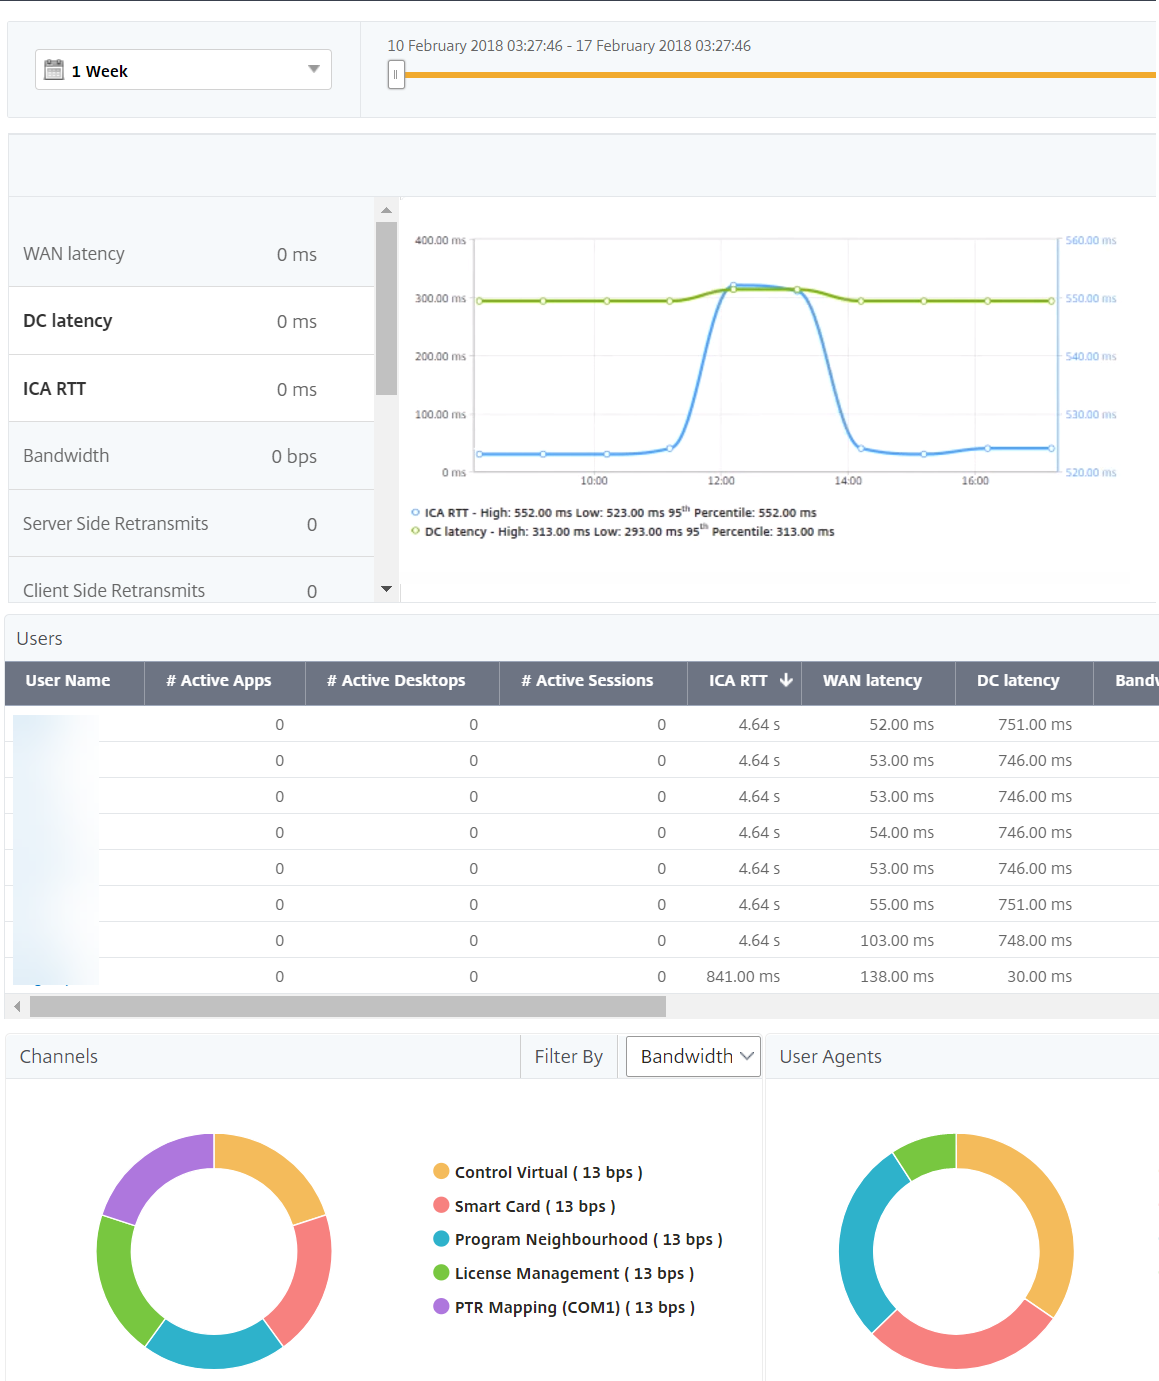
The chart displays the ICA RTT and DC latency values of the user for the specified period as a graph.
-
On the Current Sessions table, hover the mouse over the RTT value and note the host delay, DC latency, and WAN latency values.
-
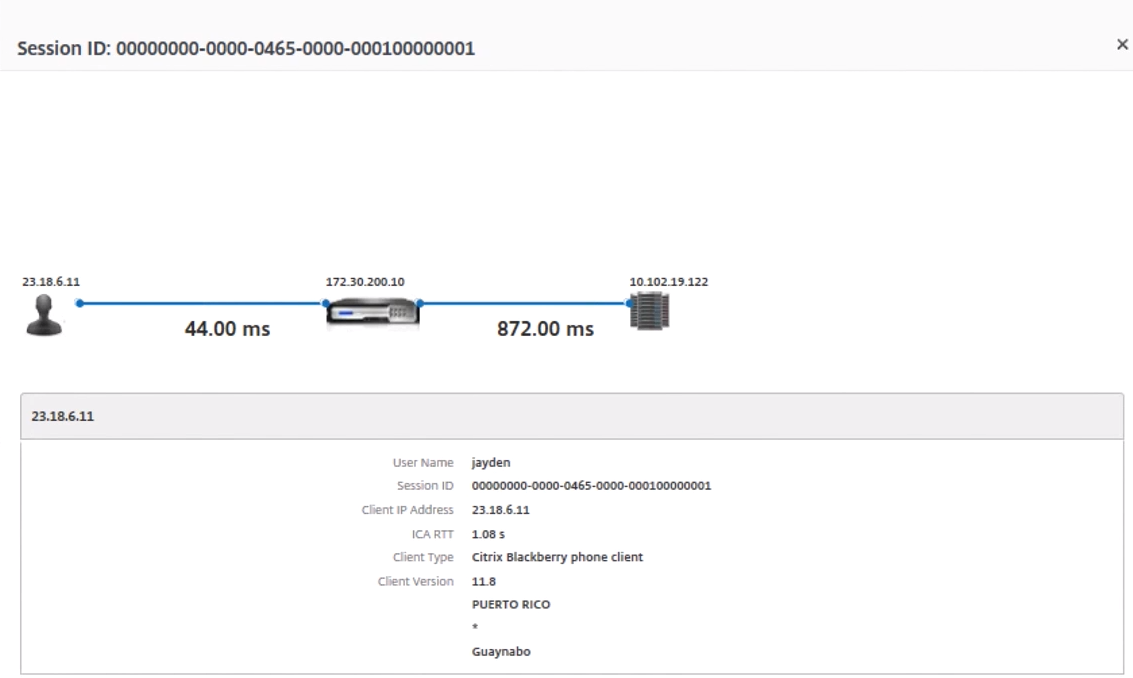
On the Current Sessions table, click the hop diagram symbol to display information about the connection between the client and the server, including latency values.
Summary
In this example, the DC Latency is 751 milliseconds, the WAN latency is 52 milliseconds, and Host Delays is 6 seconds. This indicates that the user is experiencing delay due to average latency caused by the server network.
Scenario 2
User is experiencing delay while launching an application on Citrix Virtual App or Desktop
The delay might be due to latency on the server network, ICA-traffic delays caused by the server network, latency on the client network, or time taken to launch an application.
To identify the root cause of the issue, analyze the following metrics:
-
WAN latency
-
DC latency
-
Host delay
To view the user metrics:
-
Navigate to Gateway > HDX Insight > Users.
-
Scroll down and click the user name.
-
In the graphical representation, note the WAN Latency, DC Latency, and RTT values for the particular session.
-
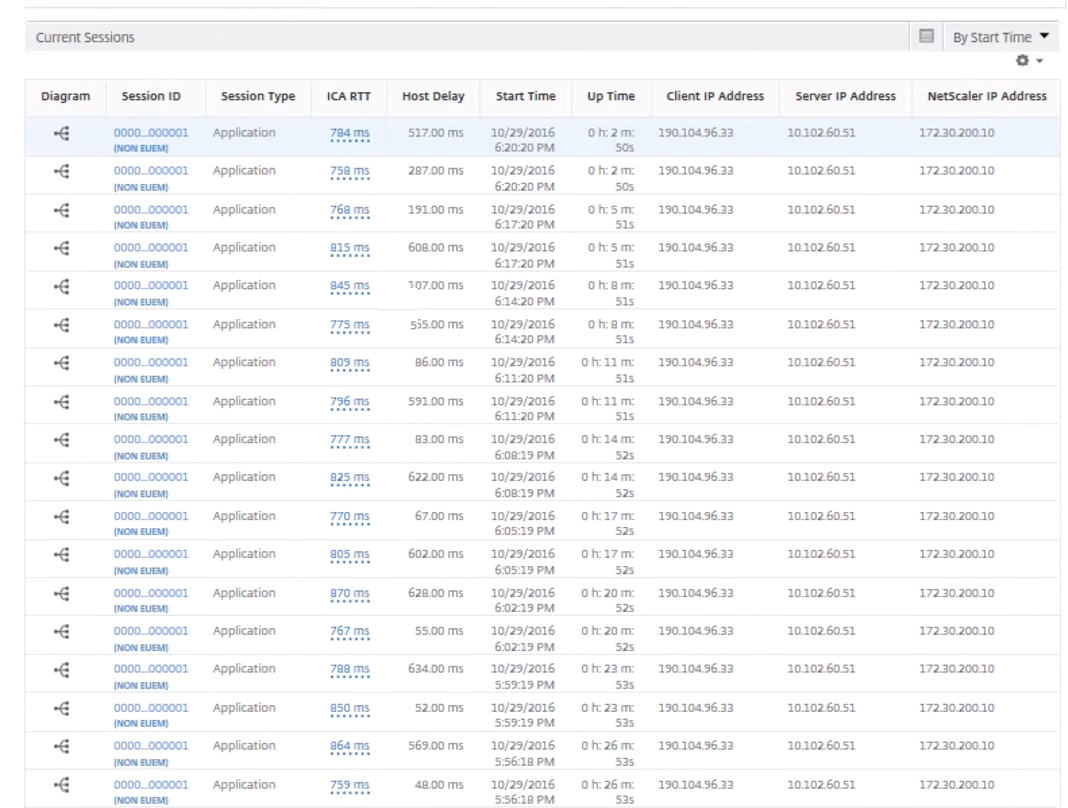
In the Current Sessions table, note that the host delay is high.
Summary
In this example, the DC Latency is 1 millisecond, the WAN latency is 12 milliseconds, but the Host Delay is 517 milliseconds. High RTT with low DC and WAN latencies indicates an application error on the host server.
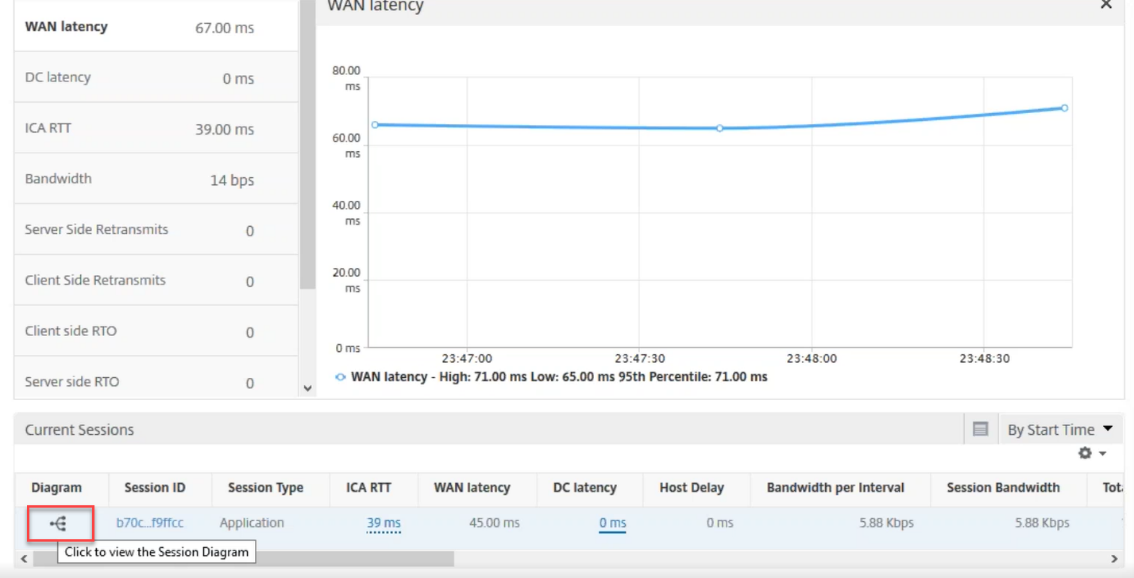
Note HDX Insight also displays more user metrics, such as WAN jitter and Server Side Retransmits if you are using NetScaler Console running software 11.1 build 51.21 or later. To view these metrics, navigate to Gateway > HDX Insight > Users, and select a user name. The user metrics appear in the table next to the graph.
Geomaps for HDX Insight
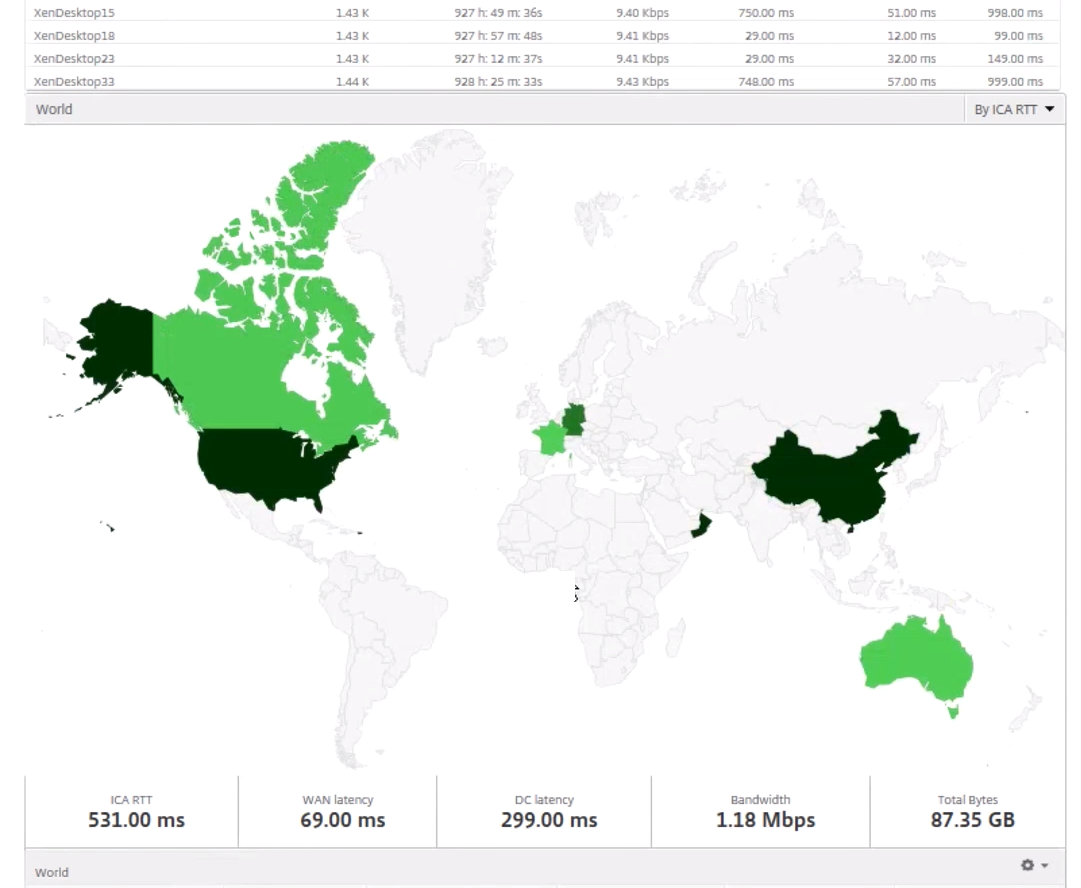
The NetScaler Console geomaps functionality displays the usage of applications across different geographical locations on a map. Administrators can use this information to understand the trends in application usage across various geographical locations.
You can configure NetScaler Console to display the geomaps for a particular geographical location or LAN by specifying the private IP range (start and end IP address) for the location.
You can also view the historical and active users’ details from the geo location maps in HDX Insight. Navigate to Gateway > HDX Insight, and in the World section of the map, click the country or region for which you want to see the details. You can further drill down to view information by city and state.
To configure a geomap for data centers:
Navigate to Settings > Analytics Settings > IP Blocks to configure geomaps for a particular location.
Use case
Consider a scenario in which organization ABC has 2 branch offices, one in Santa Clara and the other in India.
The Santa Clara users use the NetScaler Gateway appliance at SClara.x.com to access VPN traffic. The Indian users use the NetScaler Gateway appliance at India.x.com to access VPN traffic.
During a particular time-interval, say 10 AM to 5 PM, the users in Santa Clara connect to SClara.x.com to access VPN traffic. Most of the users access the same NetScaler Gateway, causing a delay in connecting to the VPN, so some users connect to India.x.com instead of SClara.x.com.
A NetScaler administrator analyzing the traffic can use the geo map functionality to show the traffic in Santa Clara office. The map shows that the response time in the Santa Clara office is high, because the Santa Clara office has only one NetScaler Gateway appliance through which users can access VPN traffic. The administrator might therefore decide to install another NetScaler Gateway, so that users have two local NetScaler Gateway appliances through which to access the VPN.
Limitations
If NetScaler instances have Advanced license, thresholds set on NetScaler Console for HDX Insight will not be triggered since analytical data is collected for only 1 hour.
Share
Share
This Preview product documentation is Cloud Software Group Confidential.
You agree to hold this documentation confidential pursuant to the terms of your Cloud Software Group Beta/Tech Preview Agreement.
The development, release and timing of any features or functionality described in the Preview documentation remains at our sole discretion and are subject to change without notice or consultation.
The documentation is for informational purposes only and is not a commitment, promise or legal obligation to deliver any material, code or functionality and should not be relied upon in making Cloud Software Group product purchase decisions.
If you do not agree, select I DO NOT AGREE to exit.