Application View Reports and Metrics
The reports and metrics in this view are focused on the Citrix Virtual Apps. Navigate to Gateway > HDX Insight > Applications
Summary View
The summary view displays the reports for all the applications that are logged in during the selected timeline.
All the metrics/reports, unless explicitly mentioned will have the values corresponding to them for the select time period.
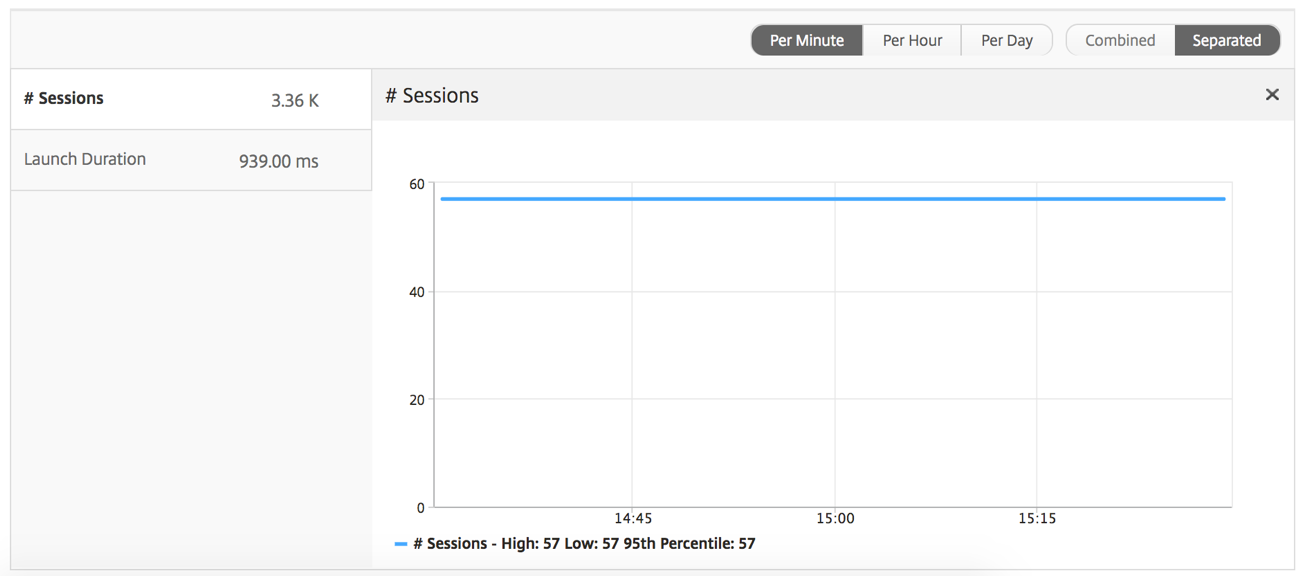
Line Chart
| Metrics | Description |
|---|---|
| Sessions | Total number of sessions during a given time interval. |
| Launch duration | Average time taken to launch an application. |
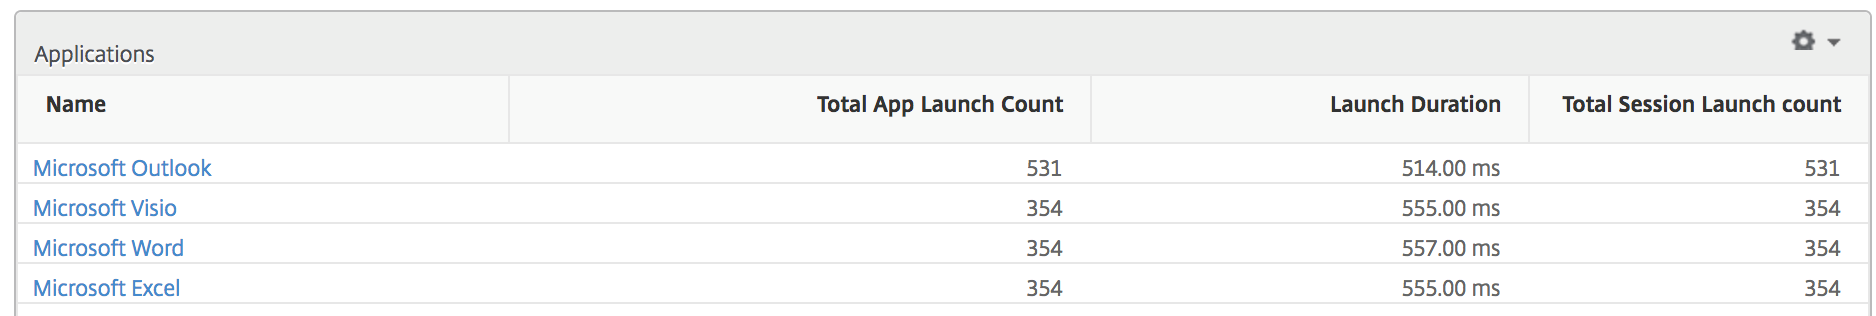
Applications Summary Report
| Metrics | Description |
|---|---|
| Name | Name of the Citrix Virtual App. |
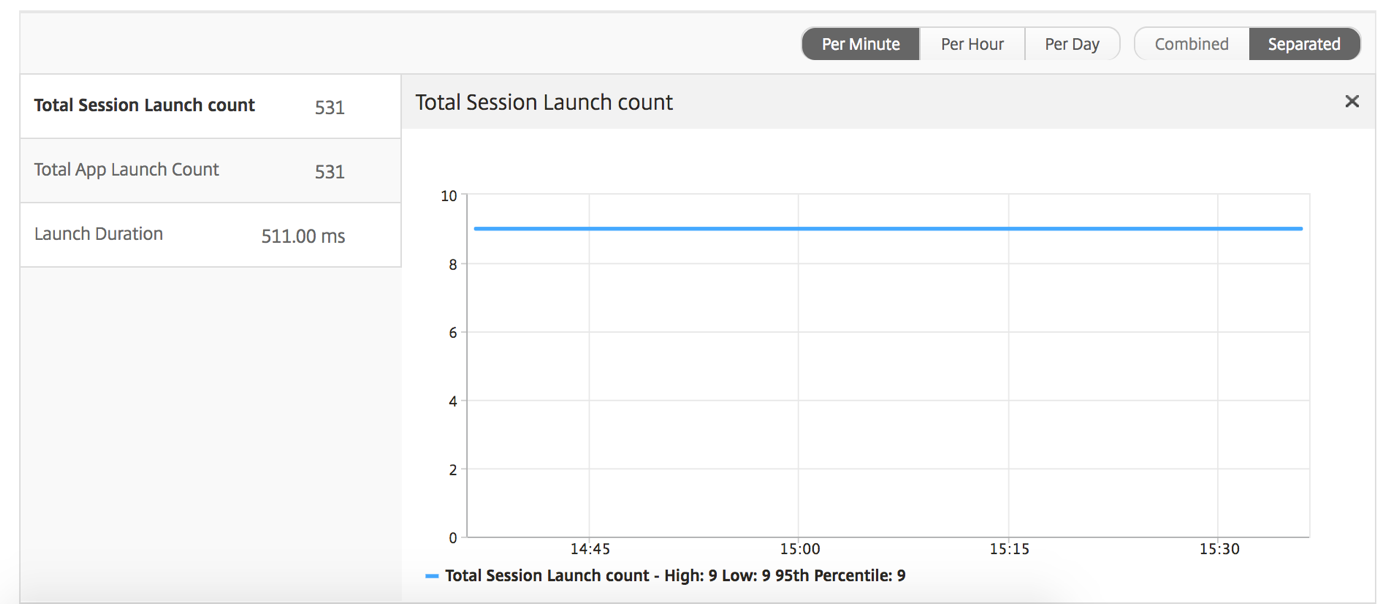
| Total Session Launch count | Total number of active Citrix Virtual App sessions during the given time interval. |
| Total App Launch Count | Total number of Citrix Virtual App applications launched during the given time interval. |
| Launch Duration | Average time taken to launch the Citrix Virtual App. |
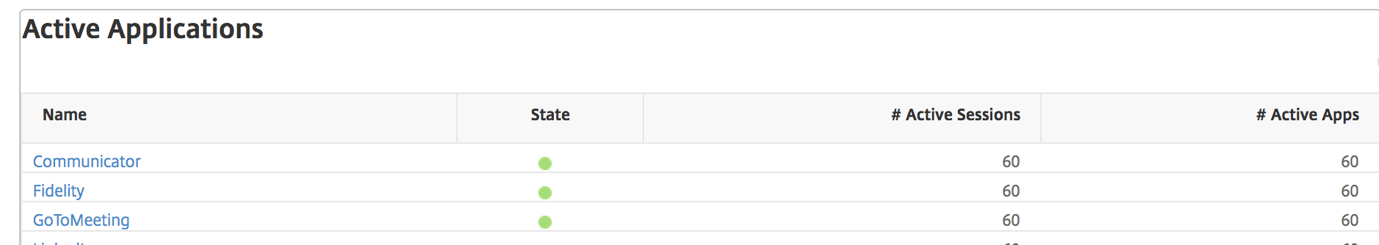
Active Application Report
| Metrics | Description |
|---|---|
| Name | Name of the Citrix Virtual App. |
| State | Displays the state of the application: Green-Active, Red-Inactive |
| #Active Sessions | Number of active user sessions using this app during a given time interval. |
| #Active Apps | Number of active sessions for this application. |
Threshold Report
The Threshold Report represents the count of thresholds breached where the entity is selected as Application in the selected period.
Line Chart
| Metrics | Description |
|---|---|
| Active Sessions | This number indicates the count of active Citrix Virtual Apps and Desktops sessions. |
| Launch duration | Average time taken to launch an application. |
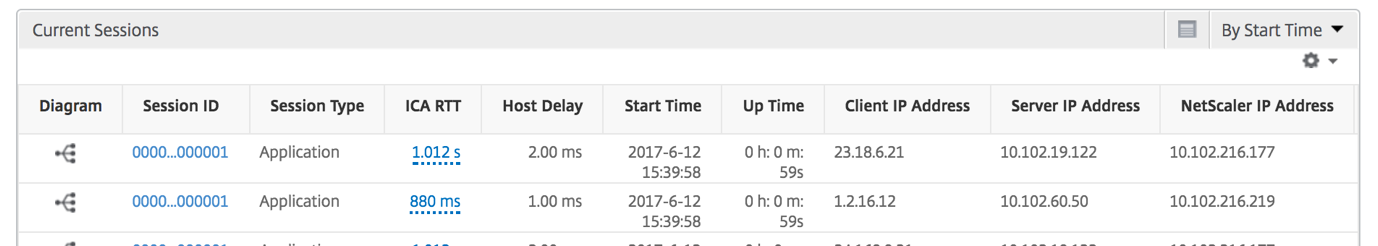
Current Sessions Report
| Metrics | Description |
|---|---|
| Session ID | A unique identity for an ICA session. |
| Session Type | Application/Desktop. |
| State | Green/Red for active/Inactive sessions. |
| Host Delay | Average delay in ICA traffic that passes through the NetScalers caused by server network. |
| Bandwidth per Interval | The bandwidth consumed by the session during that particular interval of time. |
| Session Bandwidth | The bandwidth consumed by the session irrespective of the interval of time. |
| Bytes per Interval | Number of bytes consumed by the session during that particular interval of time. |
| Start Time | Session start time. |
| Up Time | Session duration. |
| Client IP Address | End user IP. |
| Server IP Address | Backend/ Citrix Virtual App server IP. |
| NetScaler IP Address | NetScaler Management IP (NSIP). |
| Client Type | Citrix Workspace type- Citrix Windows Client. |
| Client Version | Citrix Workspace version. |
| MSI | Boolean (Yes/No). Indicates if the session is multi-stream ICA. |
| Session Reconnects | Number of times the session reconnected. |
| ACR Counts | Total number of times a client automatically reconnects users to disconnected sessions. |
| User Access Type | Displays the mode of access of the ICA session. For example, NetScaler Gateway user/transparent mode. |
| Country | Country from which the session was established. |
| Region | Region from which the session was established. |
| City | City from which the session was established. |
| USB Status | Active/Inactive -Green/Red. |
| Number of USB Instances Accepted | The count of USB instances accepted. |
| Number of USB Instances Rejected | The count of USB instances rejected. |
| Number of USB Instances Stopped | The count of USB instances stopped. |
| Client Host Name | The host name of the client. |
| HA Failover Count | Number of times HA failover occurred. |
| Reason for termination | Displays the reason for a session termination. For example, ICA Session Timeout, Session terminated by the user. |
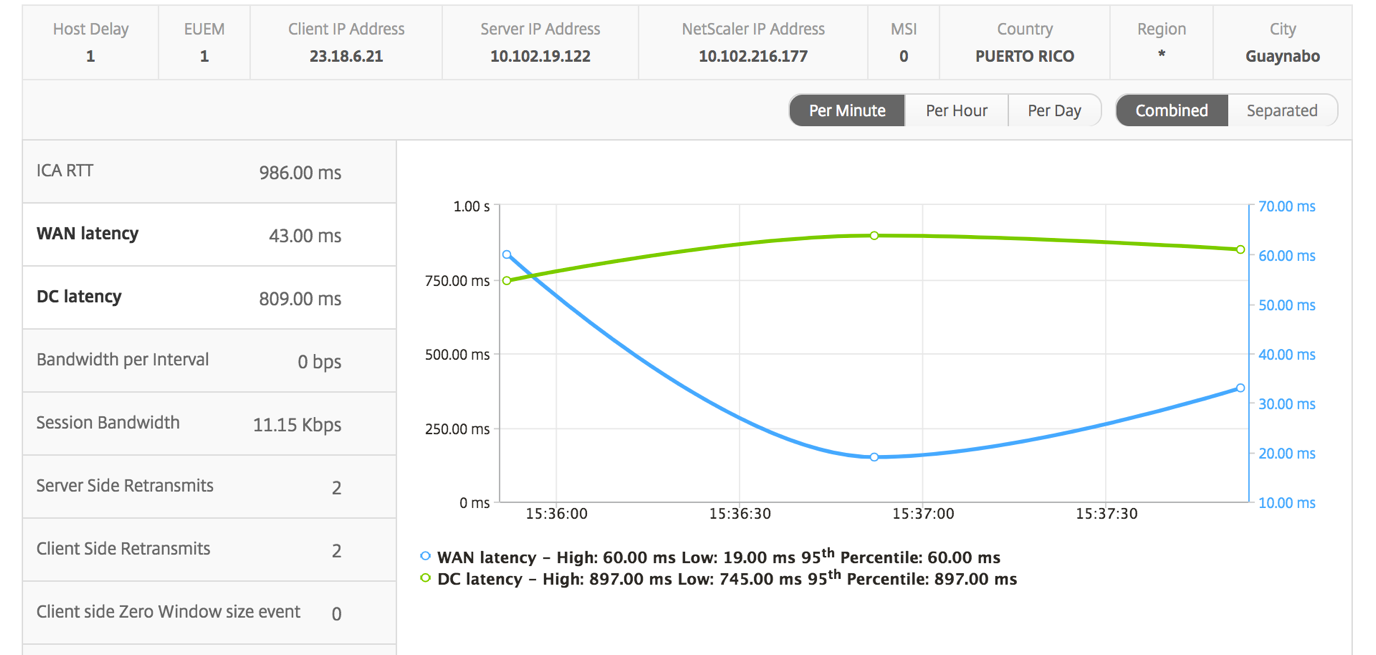
| ICA RTT | ICA RTT is the screen lag that the user experiences while interacting with an application or desktop hosted on Citrix Virtual App or Desktop respectively. |
| WAN latency | Latency caused by the client side of the network. That is, from NetScaler to end user. |
| DC latency | Latency caused by the server side of the network. That is, from NetScaler to back-end servers. |
| Total Bytes | Total Bytes consumed by the user during the selected time period. |
| Server Side Retransmits | The number of packets retransmitted on the connection between NetScaler and back-end server. |
| Client Side Retransmits | The number of packets retransmitted on the connection between NetScaler and the end user. A high value of this metric does not mean that the user experience will not be seamless but indicates high bandwidth utilization due to retransmits. |
| Client side Zero Window size event | This counter indicates the number of times the client advertised a zero TCP window. |
| Client side fast RTO | Number of times the retransmission timeout occurred the connection between NetScaler and the end user. |
| Server side Zero Window size event | This counter indicates the number of times the server advertised a zero TCP window. |
| Server side fast RTO | Number of times the retransmission timeout occurred on the connection between NetScaler and back-end server. |
| User Name | The user name of the user accessing this particular Citrix Virtual App. |
| Session ID | Unique identifier for the Citrix Virtual App session. |
| Session Type | Will be “Application”. |
| State | Session state: Green for active, Red for in-active. |
| Maximum Breach Latency | The highest value of the L7 latency when a breach of a defined threshold for a set time interval occurs. |
| Average Breach Latency | The average value of L7 latency when the system is in a “L7 latency breached” state. |
| L7 Threshold Breach Count | The number of times a L7 threshold breach has occurred. |
| L7 Client-side Latency | The average L7 latency observed between the ICA client and the NetScaler instance. This metric is useful in non-Citrix devices being present in the delivery path. |
| L7 Server-side Latency | The average L7 latency observed between the NetScaler device and the Citrix Virtual App. This metric is useful in non-Citrix devices being present in the delivery path. |
Per Application Session View
The per application session view displays reports for a particular selected application session.
To view the Session reports:
-
Navigate to Gateway > HDX™ Insight > Applications.
-
Select a particular user from the Application Summary Report.
-
Selected a session from current sessions report.
Line Chart
| Metrics | Description |
|---|---|
| Session Reconnects | Number of times the session reconnected. |
| ACR Counts | Total number of times a client automatically reconnects users to disconnected sessions. |
| ICA RTT | ICA RTT is the screen lag that the user experiences while interacting with an application or desktop hosted on Citrix Virtual App or Desktop respectively. |
| WAN latency | Latency caused by the client side of the network. That is, from NetScaler to end user. |
| Server side Zero Window size event | Latency caused by the server side of the network. That is, from NetScaler to back-end servers. |
| Bandwidth per Interval | The bandwidth consumed by the session during that particular interval of time. |
| Server Side Retransmits | The number of packets retransmitted on the connection between NetScaler and back-end server. |
| Client Side Retransmits | The number of packets retransmitted on the connection between NetScaler and the end user. A high value of this metric does not mean that the user experience will not be seamless but indicates high bandwidth utilization due to retransmits. |
| Session Bandwidth | The bandwidth consumed by the session irrespective of the interval of time. |
| Server side Zero Window size event | This counter indicates the number of times the server advertised a zero TCP window. |
| Client side fast RTO | Number of times the retransmission timeout occurred the connection between NetScaler and the end user. |
| Server side fast RTO | Number of times the retransmission timeout occurred on the connection between NetScaler and back-end server. |
| Client side Zero Window size event | This counter indicates the number of times the client advertised a zero TCP window. |
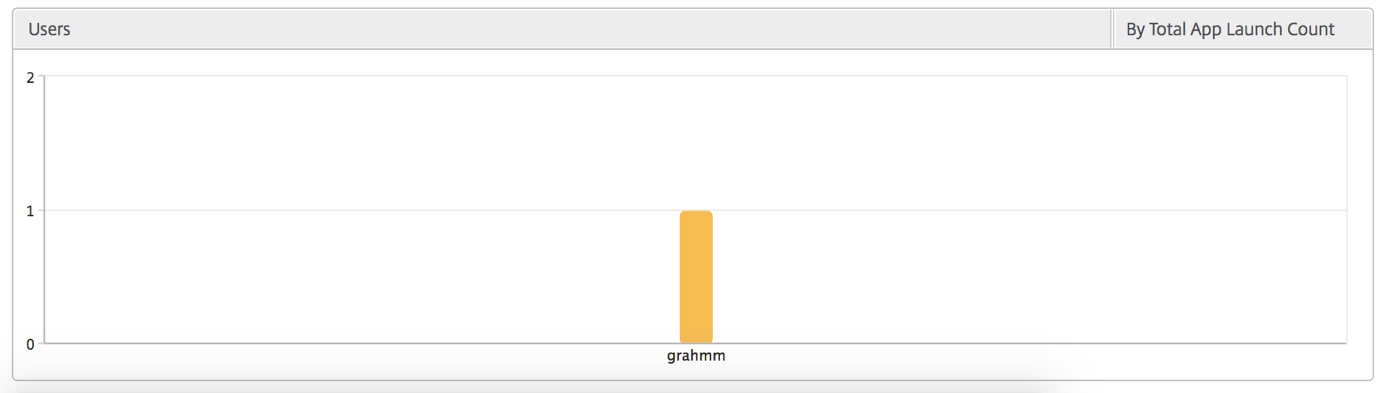
User Bar Graph
The User bar graph represents the users logged into this particular app.