-
Low-touch onboarding of NetScaler instances using Console Advisory Connect
This content has been machine translated dynamically.
Dieser Inhalt ist eine maschinelle Übersetzung, die dynamisch erstellt wurde. (Haftungsausschluss)
Cet article a été traduit automatiquement de manière dynamique. (Clause de non responsabilité)
Este artículo lo ha traducido una máquina de forma dinámica. (Aviso legal)
此内容已经过机器动态翻译。 放弃
このコンテンツは動的に機械翻訳されています。免責事項
이 콘텐츠는 동적으로 기계 번역되었습니다. 책임 부인
Este texto foi traduzido automaticamente. (Aviso legal)
Questo contenuto è stato tradotto dinamicamente con traduzione automatica.(Esclusione di responsabilità))
This article has been machine translated.
Dieser Artikel wurde maschinell übersetzt. (Haftungsausschluss)
Ce article a été traduit automatiquement. (Clause de non responsabilité)
Este artículo ha sido traducido automáticamente. (Aviso legal)
この記事は機械翻訳されています.免責事項
이 기사는 기계 번역되었습니다.책임 부인
Este artigo foi traduzido automaticamente.(Aviso legal)
这篇文章已经过机器翻译.放弃
Questo articolo è stato tradotto automaticamente.(Esclusione di responsabilità))
Translation failed!
Intelligent traffic management dashboard
The intelligent traffic management dashboard provides you with an overview of the health and other key metrics for multi-site application and analytics for authoritative DNS.
Multi-site application analytics
After you configure and deploy a multi-site application, you can view analytics for the multi-site application. For more information on how to configure a multi-site application, see configure a multi-site application. The analytics enables you to:
-
Visualize an overview of all configured applications with details such as status, total requests, and stickiness rate.
-
Drill down an application and view key metrics such as Total Requests, Stickiness hit ratio, and Health for the selected application.
-
View the application performance based on each configured site level.
-
Understand the configured sites’ performance for the selected time duration.
Navigate to Intelligent Traffic Management > Dashboard, click the Multi-Site Applications tab, and select the duration from the list to view the dashboard.
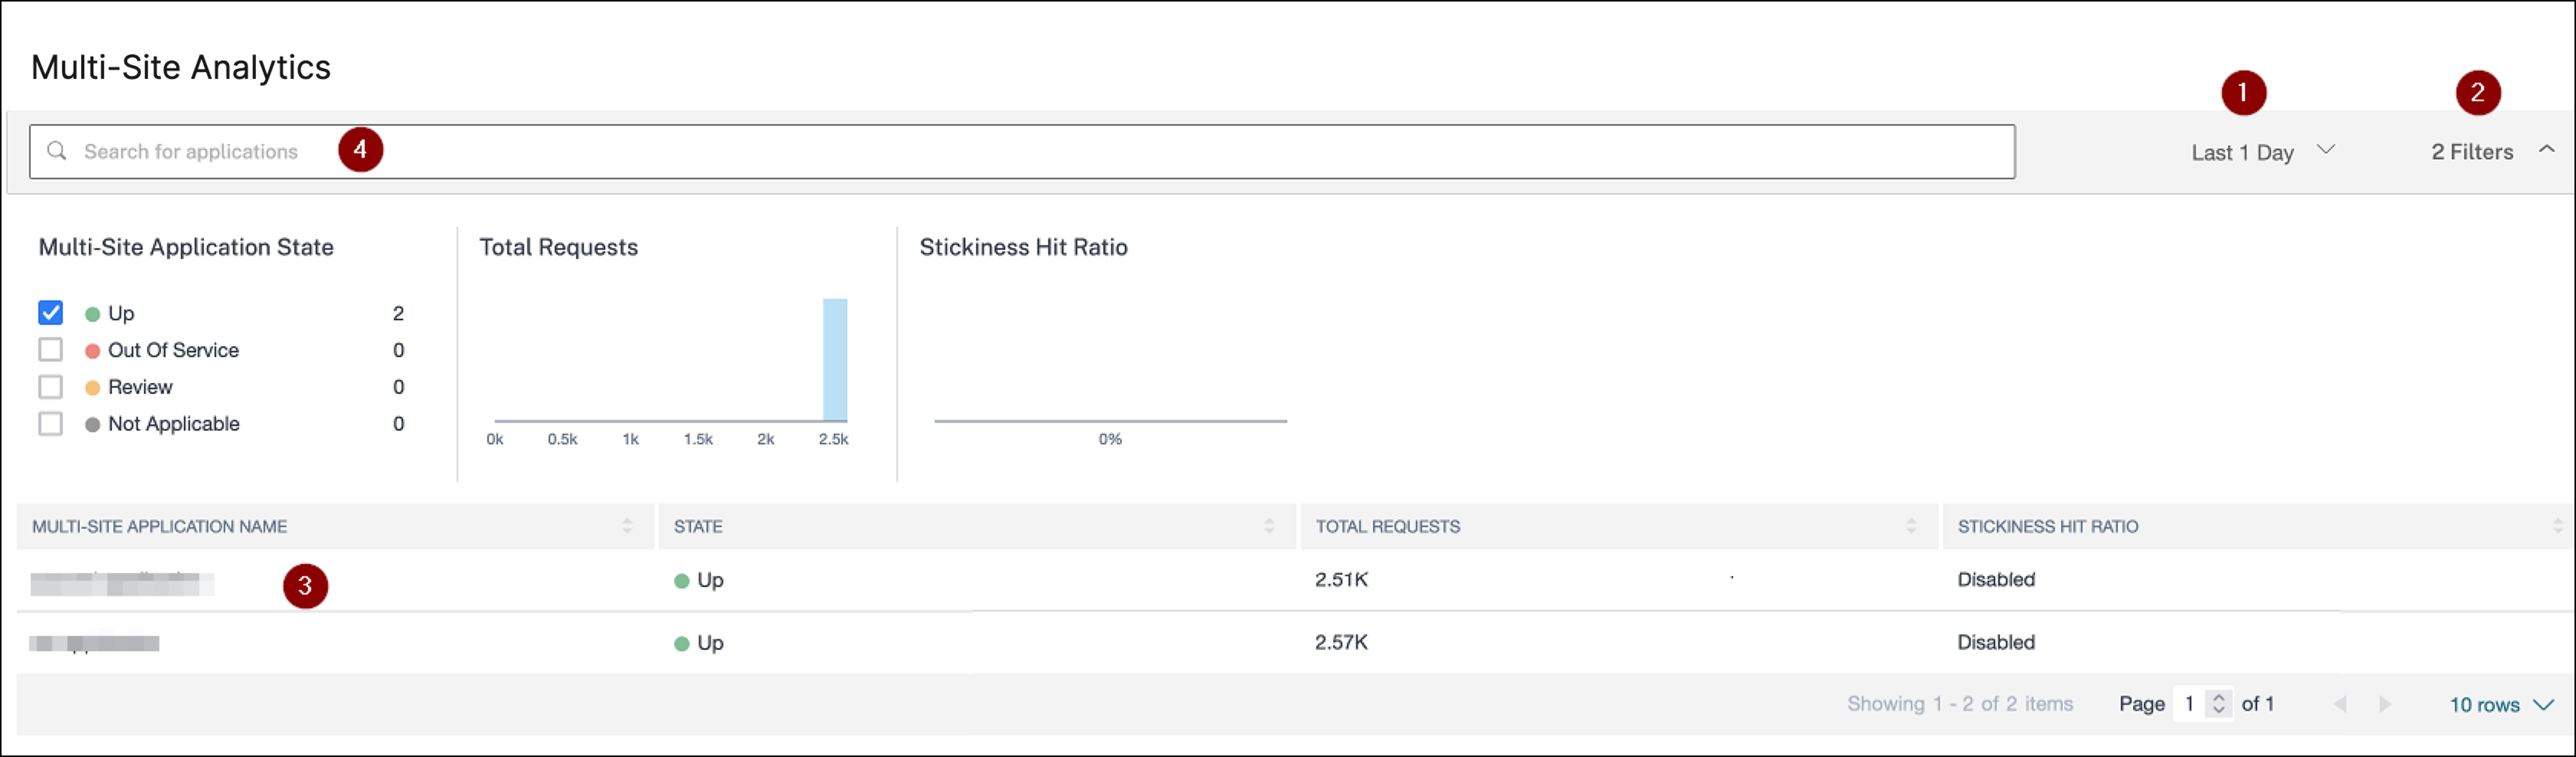
1 – Enables you to select the duration from the list to view details for a specific duration.
2 – Enables you to apply filters and view applications. You can apply filters for:
-
Multi-site Application State – Enables you to view the application based on the current application status such as UP, Out of Service, Review, and Not Applicable. By default, you can view applications that are in Up, Out Of Service, and Review status. To view applications that are in Not Applicable status, you must select the Not Applicable option.
-
UP – All configured sites are up and running
-
Out of Service – All configured sites are down and not accessible
-
Review – One or more configured sites is down and not accessible
-
Not Applicable – The multi-site application is configured, but not deployed
-
-
Total Requests – A histogram that displays the total number of requests received by the applications. Click the histogram or drag to select the range to apply filter and view applications.
-
Stickiness Hit Ratio - A histogram that displays the total percentage of successful or cached requests received by the applications.
3 – Enables you to view the overview of the applications based on the selected time duration and filters applied (if any).
4 - A search bar that enables you to filter applications based on the application names.
Click an application from the table to view the application key metrics. Under Summary, you can view the status of the application, including its sites for the selected duration.
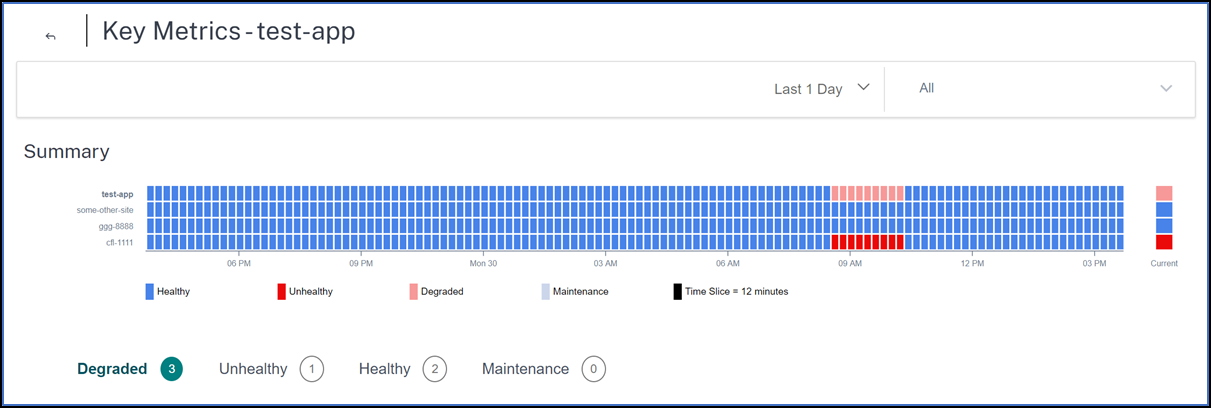
In this page, you can:
-
Select the duration from the list and view details.
-
Select the site from the location list and view details.
-
Analyze the sites performance for the selected duration.
-
Visualize how the site has performed for the selected duration.
-
Healthy – Indicates that both application and its sites are up.
-
Degraded – Indicates that the application is intermittently available.
-
Unhealthy – Indicates that the site is down and unavailable.
-
Maintenance – Indicates that the site is in maintenance mode. For more information on setting a site in maintenance mode, see Maintenance mode.
-
Not Deployed – Indicates the applications that are configured, but not yet deployed.
-
Time Slice – The duration for which the site performance status is monitored and updated. Depending upon the selected duration, the time slice period changes.
For example, if you select Last 1 Day from the list, the time slice for the selected duration is 12 minutes. This means, each rectangle displayed in the chart represents a 12-minute duration. For every 12 minutes, the site performance is monitored and the status (Healthy, Degraded, Unhealthy, and Maintenance) is updated.
-
-
Select the site from the list and monitor only the selected site.
You can view the following key metrics in a graphical format for the selected application:
-
Request Rate – The requests received by the application for the selected duration.
-
Health – The health status of the application for the selected duration.
-
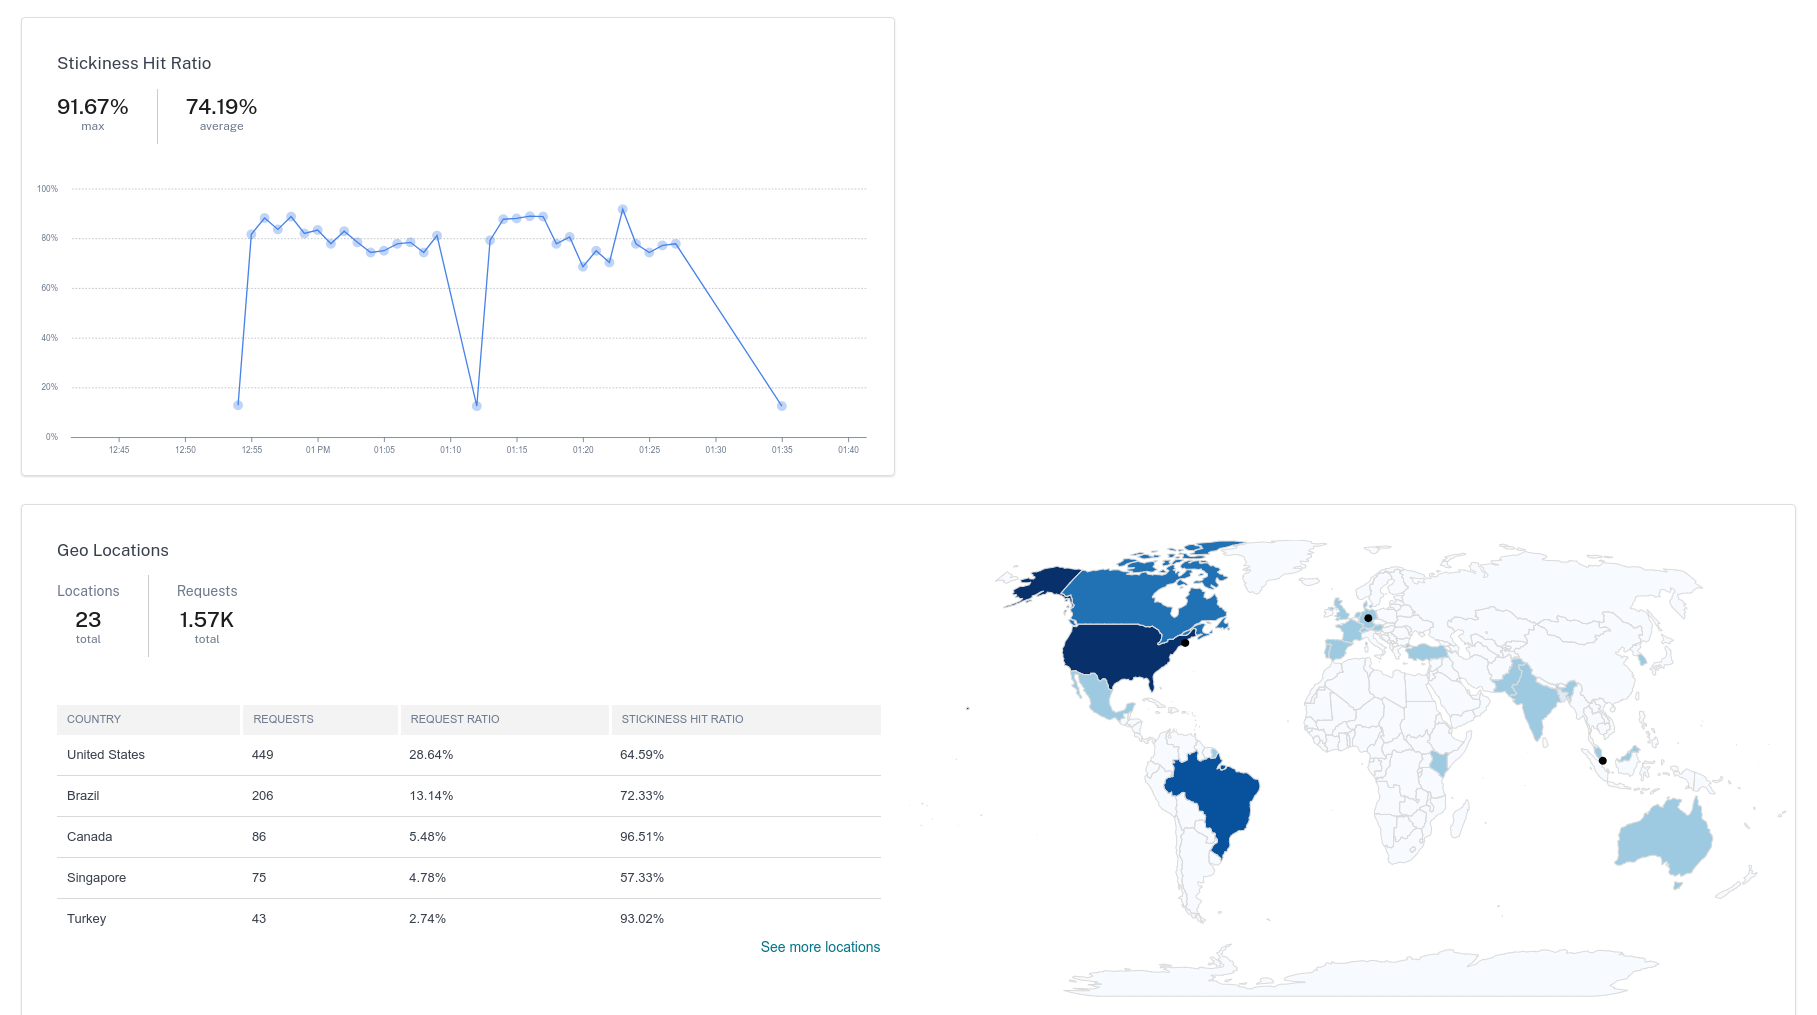
Stickiness Hit Ratio – The successfully cached requests received by the application for the selected duration.
-
Geo locations –Displays a geo map that indicates the top 5 locations based on the number of requests from each location. Click See more locations to view details for all locations.
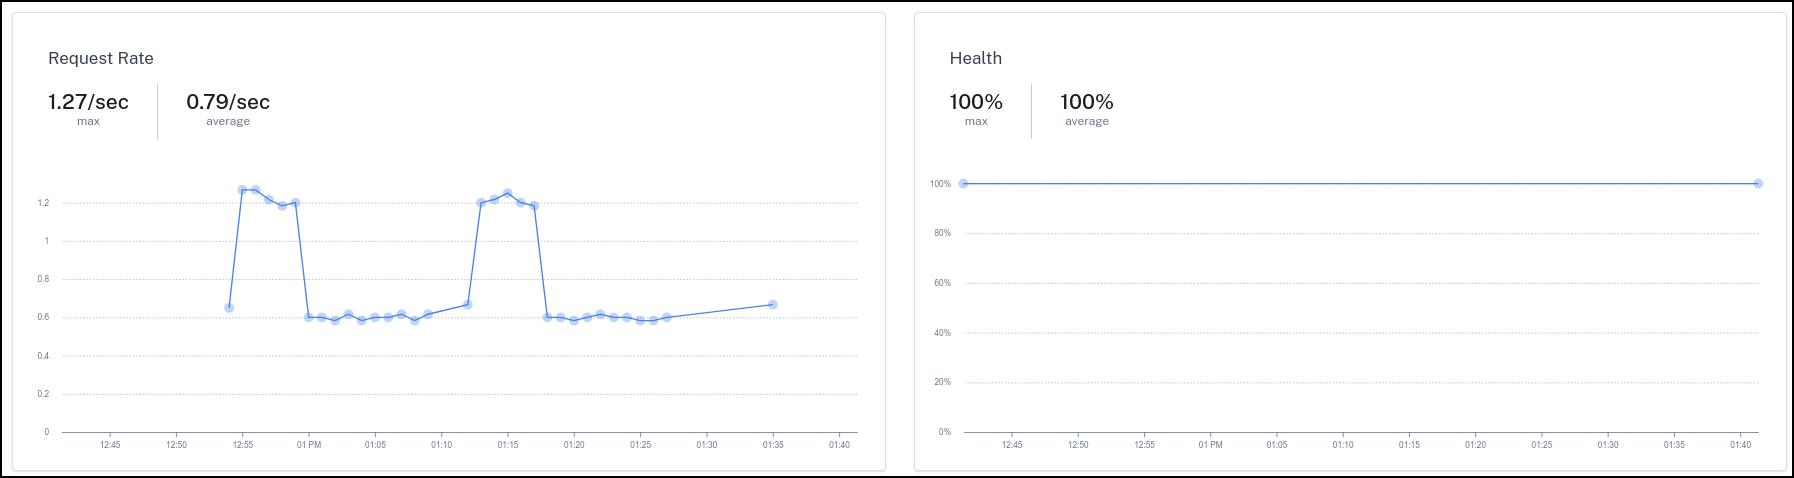
Under Request Rate and Stickiness Hit Ratio, you can view:
-
Max – The highest value for the selected duration. For example, the maximum value for the total requests in the key metrics image represents 1.27/sec. This value represents the highest request per second received during the selected duration.
-
Average – The average value for the selected duration.
Under Health, you can view:
-
Max – The total number of healthy sites for the selected duration. If all sites are healthy for a specific duration, it indicates 100% as the maximum.
-
Average – The average percentage of healthy sites for the selected duration. The average % is calculated based on the healthy sites and unhealthy sites for the selected duration.
Under Geo Location, you can view:
-
Locations – Indicates the total locations.
-
Requests – Indicates the total requests across all locations for the selected duration.
Authoritative DNS analytics
After you configure the authoritative DNS, you can view analytics for the requests that are handled by the authoritative DNS over a specific period. For information on how to configure authoritative DNS, see Configure authoritative DNS.
The analytics for authoritative DNS enables you to:
- Visualize the total number of requests that are handled by the authoritative DNS, the maximum number of requests, and the average number of requests during the selected duration.
- Filter the number of requests based on certain categories.
Navigate to Intelligent Traffic Management > Dashboard and click the Authoritative DNS tab. Select the duration, categories and then click Apply Filter to view the dashboard.
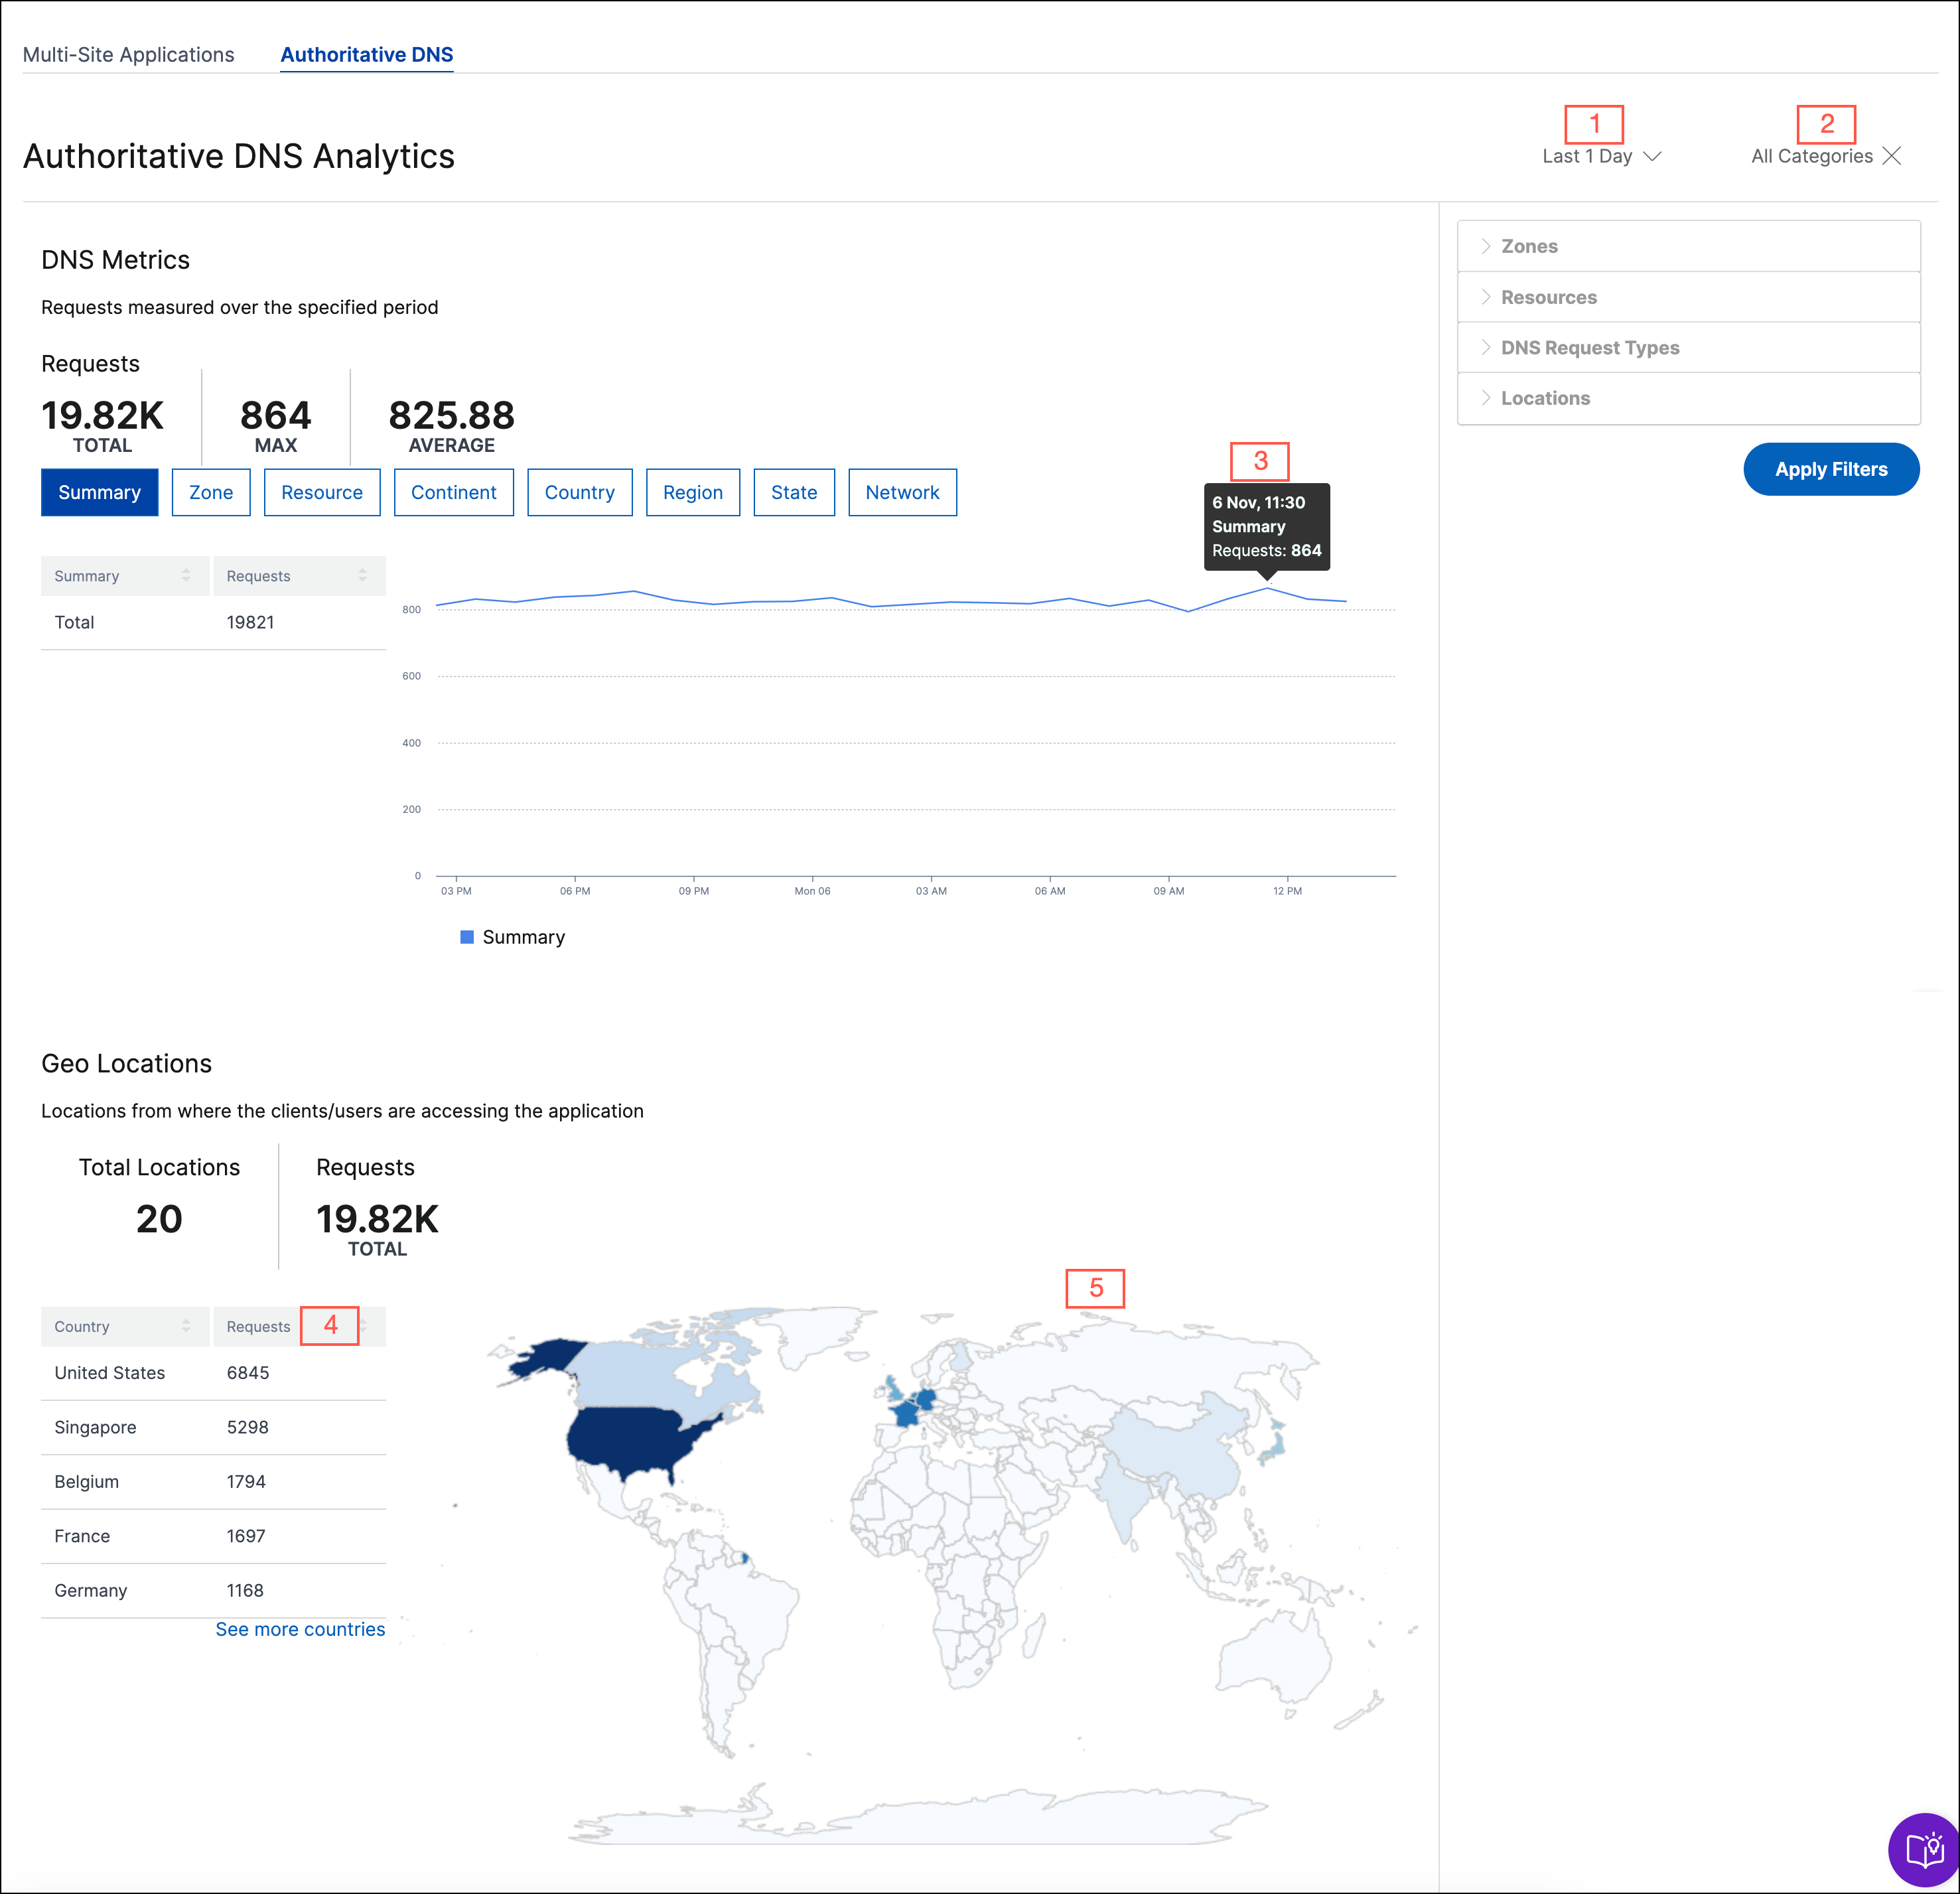
-
Enables you to select the duration from the list to view details for a specific duration.
-
Enables you to apply filters and view authoritative DNS metrics. You can apply filters for:
- Zones
- Resources
- DNS Request Types
- Continents
- Countries
- Regions
- States
- Networks
-
Hover over the graph to see the timestamp and the number of requests received.
-
Provides the list of locations from where the clients are accessing the application. Click See more locations to view the complete list.
-
Displays the heatmap showing the locations from where the clients are accessing the application.
Share
Share
In this article
This Preview product documentation is Cloud Software Group Confidential.
You agree to hold this documentation confidential pursuant to the terms of your Cloud Software Group Beta/Tech Preview Agreement.
The development, release and timing of any features or functionality described in the Preview documentation remains at our sole discretion and are subject to change without notice or consultation.
The documentation is for informational purposes only and is not a commitment, promise or legal obligation to deliver any material, code or functionality and should not be relied upon in making Cloud Software Group product purchase decisions.
If you do not agree, select I DO NOT AGREE to exit.