-
Low-touch onboarding of NetScaler instances using Console Advisory Connect
This content has been machine translated dynamically.
Dieser Inhalt ist eine maschinelle Übersetzung, die dynamisch erstellt wurde. (Haftungsausschluss)
Cet article a été traduit automatiquement de manière dynamique. (Clause de non responsabilité)
Este artículo lo ha traducido una máquina de forma dinámica. (Aviso legal)
此内容已经过机器动态翻译。 放弃
このコンテンツは動的に機械翻訳されています。免責事項
이 콘텐츠는 동적으로 기계 번역되었습니다. 책임 부인
Este texto foi traduzido automaticamente. (Aviso legal)
Questo contenuto è stato tradotto dinamicamente con traduzione automatica.(Esclusione di responsabilità))
This article has been machine translated.
Dieser Artikel wurde maschinell übersetzt. (Haftungsausschluss)
Ce article a été traduit automatiquement. (Clause de non responsabilité)
Este artículo ha sido traducido automáticamente. (Aviso legal)
この記事は機械翻訳されています.免責事項
이 기사는 기계 번역되었습니다.책임 부인
Este artigo foi traduzido automaticamente.(Aviso legal)
这篇文章已经过机器翻译.放弃
Questo articolo è stato tradotto automaticamente.(Esclusione di responsabilità))
Translation failed!
Instance View Reports and Metrics
The reports and metrics in the instance view are focused on one or more NetScaler instances.
To navigate to the Instance view:
-
Log on to your NetScaler Console using a supported web browser.
-
Navigate to Gateway > HDX™ Insight > Instances.
Instance Summary View
This view is called the summary view as it shows the reports for all the NetScaler instances that are added to NetScaler Console.
All these metrics/reports, unless explicitly mentioned have the values corresponding to them for the selected time period.
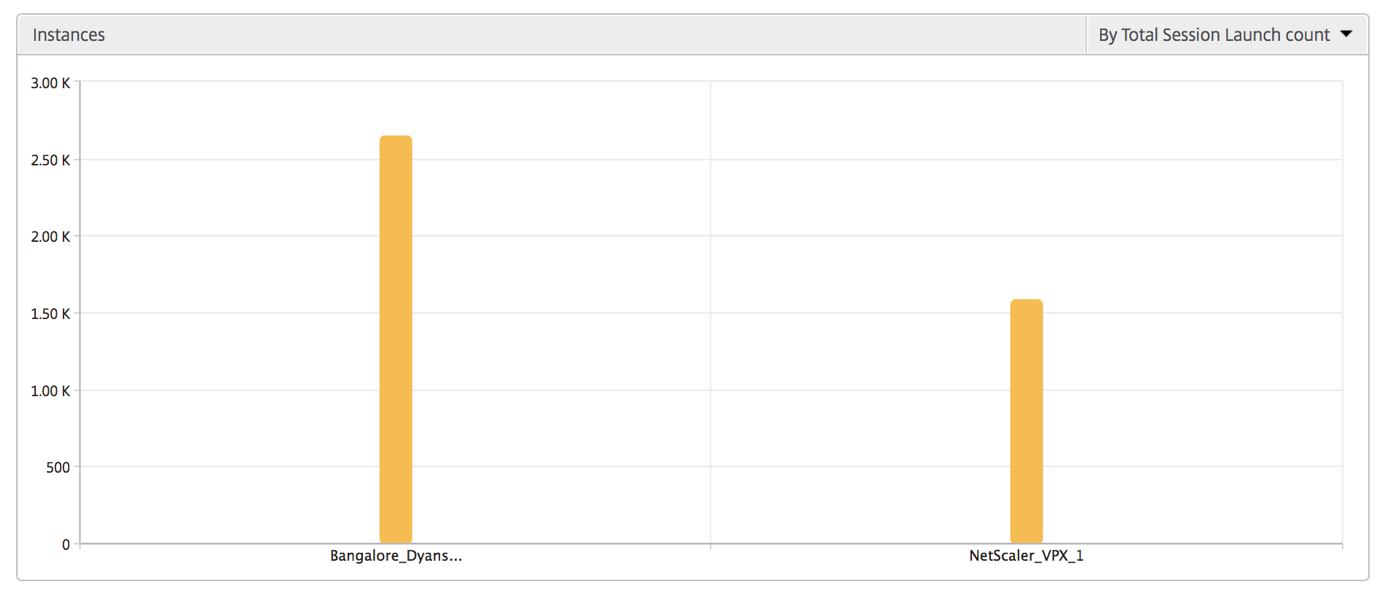
Instance Bar Graph
This graph displays the instance vs the Total Session Launch count and Total Apps from the list on the top right on the graph canvas.

Instance/Active Instances Summary Report
| Metrics | Description |
|---|---|
| Name | Host name of the NetScaler instance. |
| IP Address | NetScaler IP address. |
| Total Session Launch count | Total number of unique user sessions created during a given time interval. |
| Total Apps | Total number of unique applications launched during a given time interval. |
| Type | N/A |

Threshold Report
Threshold report represents the count of thresholds breached where the entity is selected as Instance in the selected period. For more information, see how to create thresholds and alerts.
Skipped Flows
A skipped flow is a record which skipped parsing ICA® connection. This flow can occur due to multiple reasons like using unsupported Citrix Virtual App orDesktop versions, unsupported version of workspace or workspace type, and so on. This table shows the IP address and the skipped flow count. These workspaces may not be part of allow list workspaces. Hence these sessions are skipped from monitoring.
For more details on issues related to ICA parsing, see Record generation issue for HDX/ICA traffic in NetScaler checklist

World View
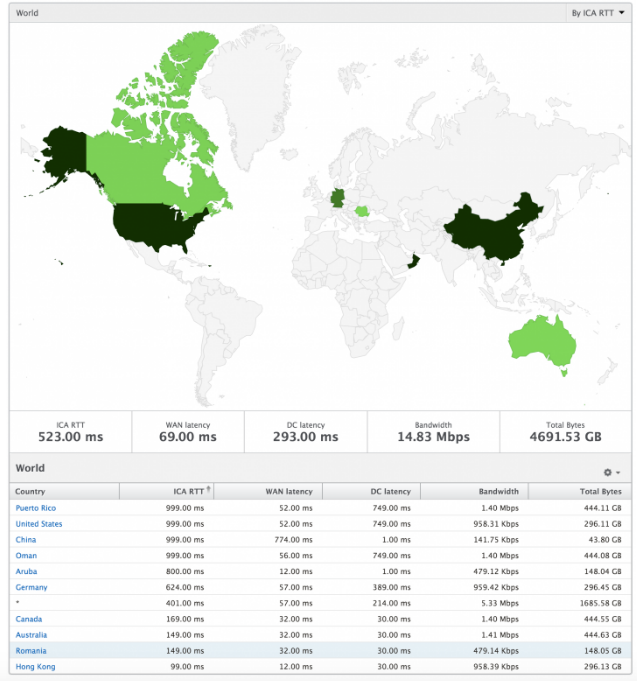
The World Map view in HDX insight allows the administrators to view the historical and active users details from a geographical point of view. The administrators can have a World view of the system, drill-down to a particular country and further into cities as well by clicking the region. The administrators can further drill down to view information by city and state. From NetScaler Console version 12.0 and later, you can drill down to users connected from a Geo location.
The following details can be viewed on the World Map in HDX insight, and the density of each metric is displayed in the form of a heat map:
-
ICA RTT
-
WAN Latency
-
DC Latency
-
Bandwidth
-
Total Bytes

Per Instance View
Per instance view provides detailed end user experience reporting for a particular selected NetScaler instance.
To navigate to the Instance view:
-
Navigate to Gateway > HDX Insight > Instances.
-
Select a particular Instance from the Instance Summary Report.
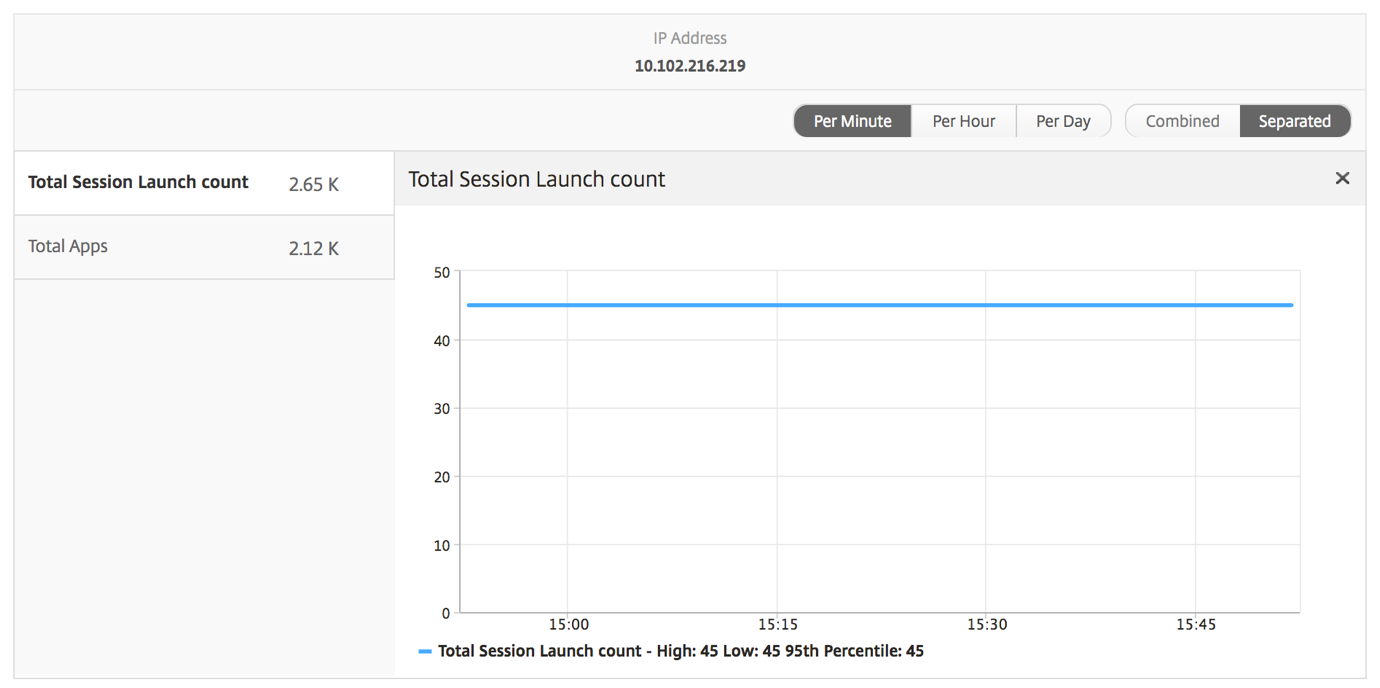
Line Chart
| Metrics | Description |
|---|---|
| IP Address | This represents the NetScaler IP address of the selected instance. |
| Total session launch count | Total number of active Citrix Virtual App sessions during the given time interval. |
| Total Apps | Total number of unique applications launched during a given time interval. |

Applications Bar Graph
Displays the top 5 applications based on Active apps, total session launch count, total app launch count, or launch duration.

Users Bar Graph
The Users bar graph displays top 5 users based on the following criteria
-
Bandwidth
-
WAN Latency
-
DC Latency
-
ICA RTT

Desktop Users Report
This table gives the insight into the Citrix Virtual Desktop sessions for a particular user. These metrics can be sorted by Desktop Launch Count and Bandwidth.
| Metrics | Description |
|---|---|
| Name | The Citrix Virtual Desktop name. |
| Desktop Launch Count | Number of times the desktop has launched. |
| Bandwidth | Total bytes per second taken for end to end communication during the selected time interval. |
| DC latency | Latency caused by the server side of the network. That is, from NetScaler to back-end servers. |
| WAN latency | Latency caused by the client side of the network. That is, from NetScaler to end user. |
| ICA RTT | ICA RTT is the screen lag that the user experiences while interacting with an application or desktop hosted on Citrix Virtual App or Desktop respectively. |

World View
The World Map view in HDX insight allows the administrators to view the historical and active users details from a geographical point of view. The administrators can have a World view of the system, drill-down to a particular country and further into cities as well by clicking the region. The administrators can further drill down to view information by city and state. From NetScaler Console version 12.0 and later, you can drill down to users connected from a Geo location.
The following details can be viewed on the World Map in HDX insight, and the density of each metric is displayed in the form of a heat map:
-
ICA RTT
-
WAN Latency
-
DC Latency
-
Bandwidth
-
Total Bytes

Share
Share
In this article
This Preview product documentation is Cloud Software Group Confidential.
You agree to hold this documentation confidential pursuant to the terms of your Cloud Software Group Beta/Tech Preview Agreement.
The development, release and timing of any features or functionality described in the Preview documentation remains at our sole discretion and are subject to change without notice or consultation.
The documentation is for informational purposes only and is not a commitment, promise or legal obligation to deliver any material, code or functionality and should not be relied upon in making Cloud Software Group product purchase decisions.
If you do not agree, select I DO NOT AGREE to exit.