-
Low-touch onboarding of NetScaler instances using Console Advisory Connect
-
-
License reporting
-
Scenarios for Flexed or Pooled license expiry and connectivity issues behavior
-
Configure NetScaler Console server only as the Flexed or Pooled license server
This content has been machine translated dynamically.
Dieser Inhalt ist eine maschinelle Übersetzung, die dynamisch erstellt wurde. (Haftungsausschluss)
Cet article a été traduit automatiquement de manière dynamique. (Clause de non responsabilité)
Este artículo lo ha traducido una máquina de forma dinámica. (Aviso legal)
此内容已经过机器动态翻译。 放弃
このコンテンツは動的に機械翻訳されています。免責事項
이 콘텐츠는 동적으로 기계 번역되었습니다. 책임 부인
Este texto foi traduzido automaticamente. (Aviso legal)
Questo contenuto è stato tradotto dinamicamente con traduzione automatica.(Esclusione di responsabilità))
This article has been machine translated.
Dieser Artikel wurde maschinell übersetzt. (Haftungsausschluss)
Ce article a été traduit automatiquement. (Clause de non responsabilité)
Este artículo ha sido traducido automáticamente. (Aviso legal)
この記事は機械翻訳されています.免責事項
이 기사는 기계 번역되었습니다.책임 부인
Este artigo foi traduzido automaticamente.(Aviso legal)
这篇文章已经过机器翻译.放弃
Questo articolo è stato tradotto automaticamente.(Esclusione di responsabilità))
Translation failed!
License reporting
Important:
File-based licensing system (also referred to as manually managed entitlements), traditionally used for activating various on-premises components, will be End of Life (EOL) on April 15, 2026. License Activation Service (LAS) is the next generation technology for product activations across the suite of Citrix products. LAS will be the only way to activate and license NetScaler instances after April 15, 2026, supporting NetScaler Flexed licenses (CPL/UHMC), legacy NetScaler Pooled licenses, and NetScaler Fixed term Bandwidth licenses. To remain supported, your NetScaler and NetScaler Console deployments must be on a LAS compatible version.
The minimum required NetScaler versions that are LAS compatible are:
NetScaler ADCs: 14.1-51.x, 13.1-60.x, 13.1-37.246 (FIPS), 14.1-66.68 (FIPS)
NetScaler SVM: 14.1-51.x, 13.1-60.x
NetScaler Console Service: Supported from early September 2025.
NetScaler Console on-prem: 14.1-51.x
Note: LAS support for Console on-prem is from release 14.1-51.x onwards. However, file-based licensing is deprecated as of April 15 2026 from Console on-prem releases 14.1-51.x onwards and 13.1-60.x onwards. If you upgrade to Console on-prem release 14.1-51.x or release 13.1-60.x or later, you can continue using file-based licensing until 15th April 2026. However you must upgrade to Console on-prem release 14.1-51.x or later, and switch to LAS before 15th April 2026 because Console on-prem 13.1 does not support LAS.
All the other forms of legacy NetScaler licenses such as Pooled vCPU, CICO, perpetual will not be supported with LAS. NetScaler instances leveraging perpetual licenses without an active maintenance will become unlicensed upon upgrade to the above mentioned software versions.
LAS based licenses may not be available to customers where prohibited by law or regulations.
If you have questions or concerns, contact Customer Care. Citrix may limit or suspend your Citrix Maintenance for non-compliance with these requirements without liability in addition to any other remedies Citrix may have at law or equity. These requirements don’t apply where prohibited by law or regulation.
In this dashboard, you can view details about:
Note:
If you had pooled licenses earlier, and now purchased and applied Flexed licenses, the combined entitlement now appears in the Flexed license dashboard.
-
Software instance (VPX, MPX, and SDX, and VPX FIPs) entitlement and allocation
-
Bandwidth/throughput-capacity entitlement, allocation, and actual usage
-
Peak and average allocation across all managed or selected instances
-
Peak and average usage across all managed or selected instances
| Features (for NetScaler instances) | Description |
|---|---|
| Entitlement | The total instance entitlements for software instance types (VPX, SDX, MPX). |
| Allocation | The total instance allocation for software instance types (VPX, SDX, MPX). |
| Features (for bandwidth/throughput-capacity) | Description |
|---|---|
| Entitlement | The total bandwidth/throughput-capacity entitlements across all managed NetScaler instances. The total entitlements are calculated from the licenses applied in License management (NetScaler Licensing > License Management). |
| Allocation | The bandwidth/throughput-capacity that are allocated to Licensed NetScalers in Flexed License Dashboard (NetScaler Licensing > Flexed Licensing > Dashboard). |
| Usage | The total throughput consumed by the NetScaler instances. |
Note:
A flexed license supports only the premium edition. However, if you have bought and applied flexed licenses, and had pooled standard or advanced bandwidth capacity earlier, the details related to bandwidth/throughput-capacity (standard or advanced) are also listed. For example, you have applied 1000 Gbps Flexed license (which is premium) and also have an active Pooled license of 100 Gbps Advanced Bandwidth, then the reporting dashboard shows both Premium 1000 Gbps and 100 Advanced Bandwidth.
The following example helps you understand how the dashboard displays the peak usage and average usage:
Consider that there are 3 managed NetScaler instances (NetScaler A, NetScaler B, and NetScaler C) with Flexed license (Premium bandwidth) and the selected duration is 1 day. For calculations, NetScaler Console considers datapoints (in Mbps) for each hour per NetScaler instance. For 1 day, there are 24 datapoints for each NetScaler instance. So, for 3 NetScaler instances, there are (24 * 3) datapoints.
-
Peak usage = The sum of the highest datapoint (Mbps) from the 24 hours of all NetScaler instances. For example, if the highest datapoint from the 24-hour duration for NetScaler A is 30 Mbps, NetScaler B is 45 Mbps, and NetScaler C is 120 Mbps, then the peak usage is displayed as 195 Mbps (30 + 45 + 120).
-
Average usage = The sum of all the 24 hours datapoints divided by 24 for each NetScaler instance. So, for 3 NetScaler instances, the total average of all 3 NetScaler instances divided 3. For example, if NetScaler A average is 25 Mpbs, NetScaler B average is 20 Mpbs, and NetScaler C average is 45 Mbps, the average usage is displayed as 30 Mbps (25 + 20 + 35 divided by 3).
Similarly, the peak and average allocation details are displayed using the same logic.
You can select the duration from the list, starting from an hour to a year, and view the details in both tabular view and graphical view.
The following example shows the tabular view for the instances using Flexed license (Premium bandwidth):
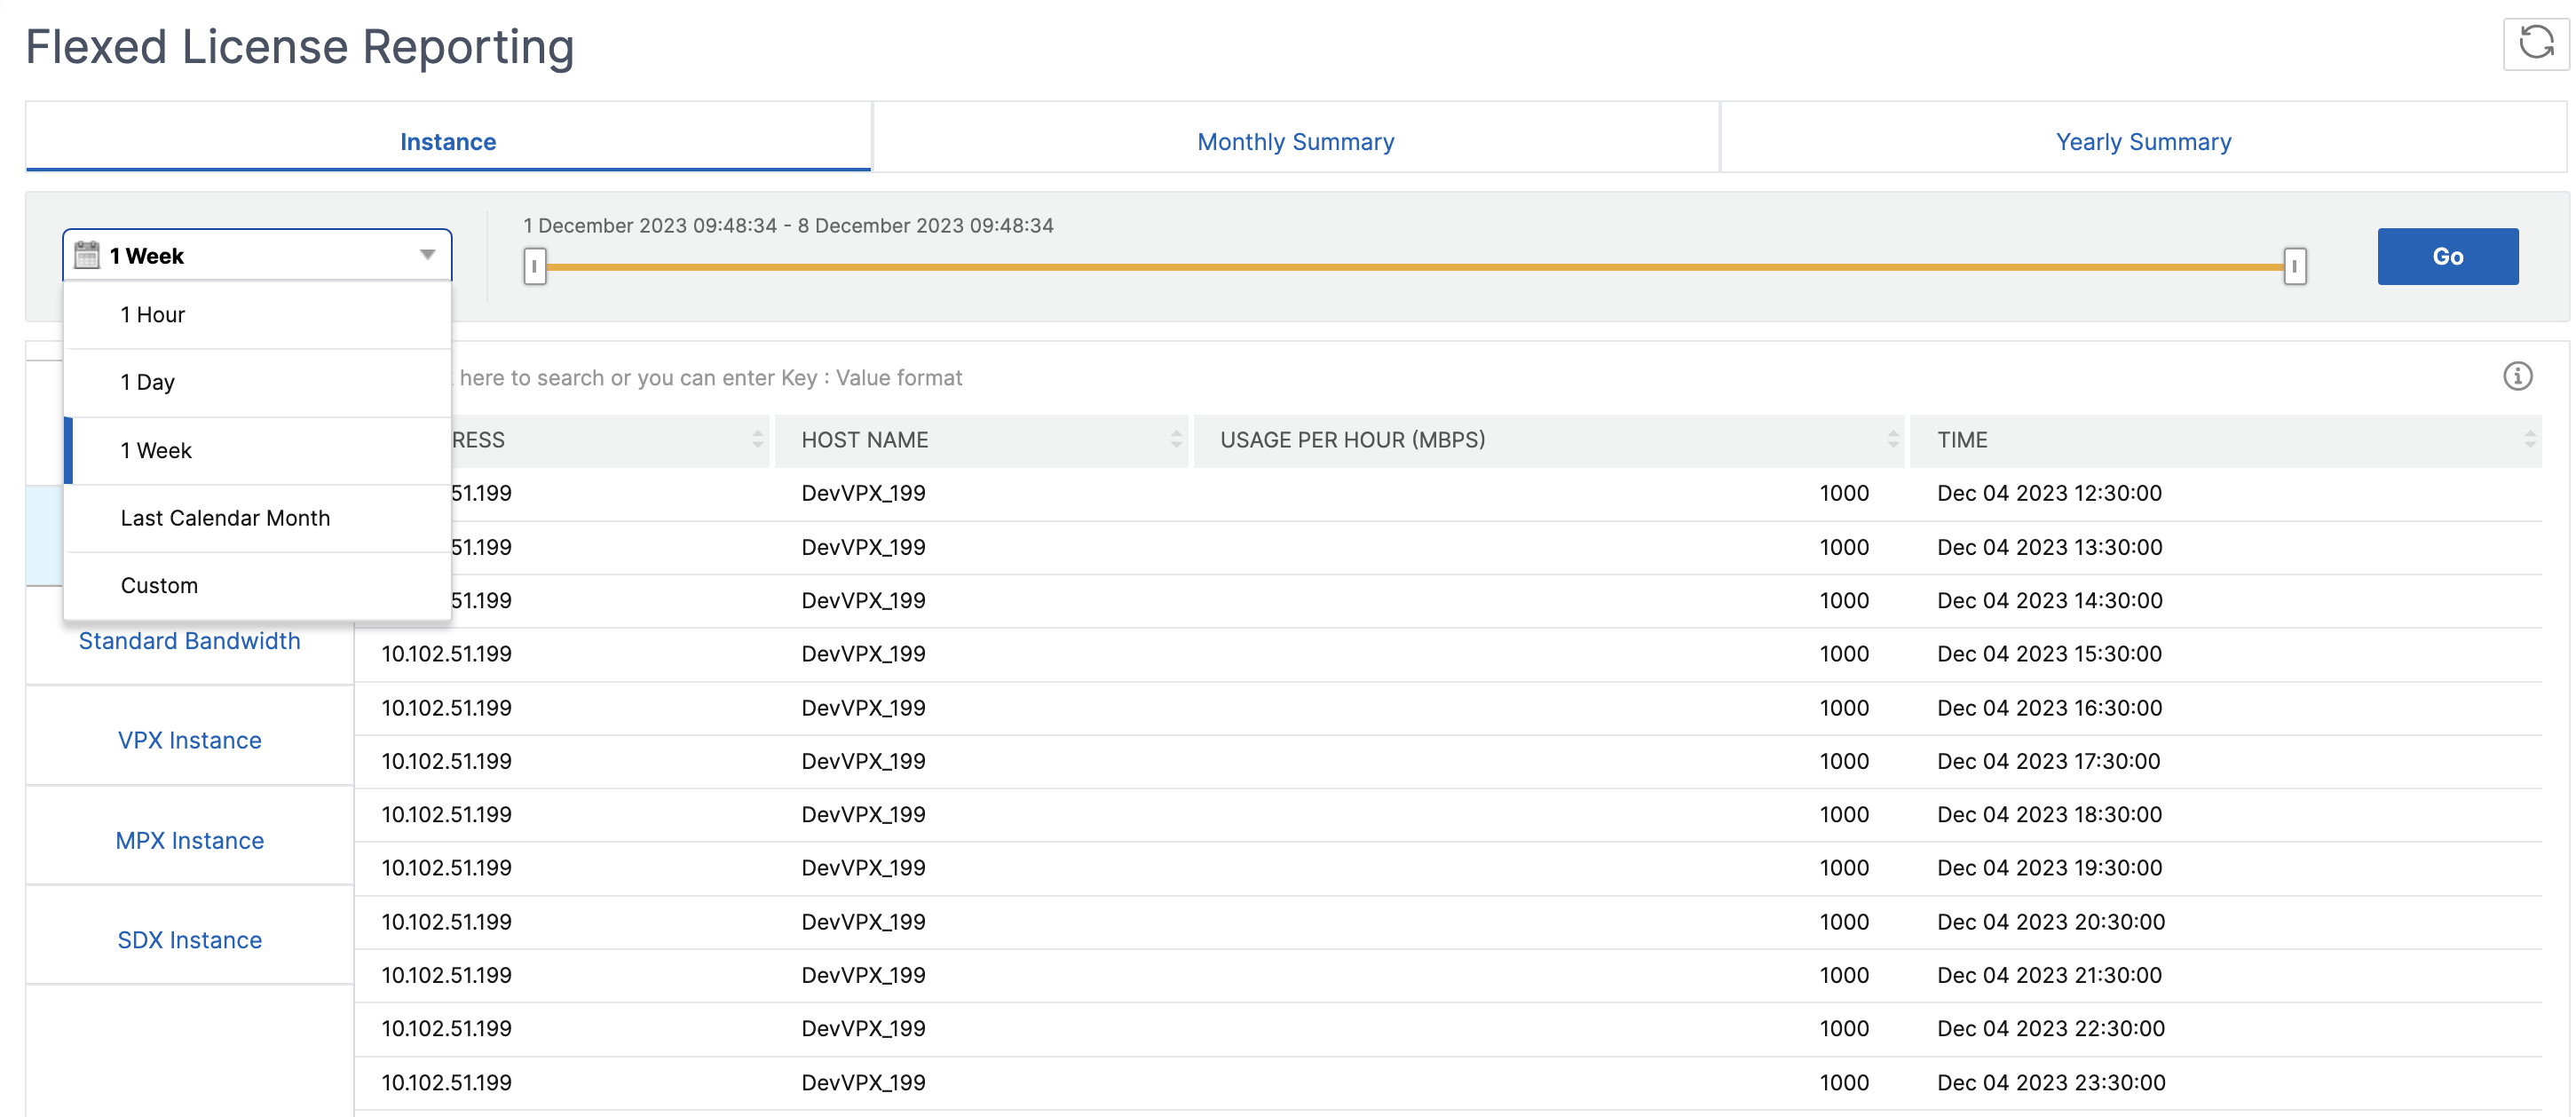
The following details appear on the dashboard:
-
Peak usage - The highest usage (in Mbps) for the selected duration.
-
Average usage - The average usage (in Mbps) for the selected duration.
-
Peak allocated - The highest allocation for the selected duration.
-
Average allocation - The average allocation for the selected duration.
-
Filter - You can select one or more instances to view the usage and allocation details for the specific instances.
-
Export - You can export details in PDF, JPEG, and PNG format.
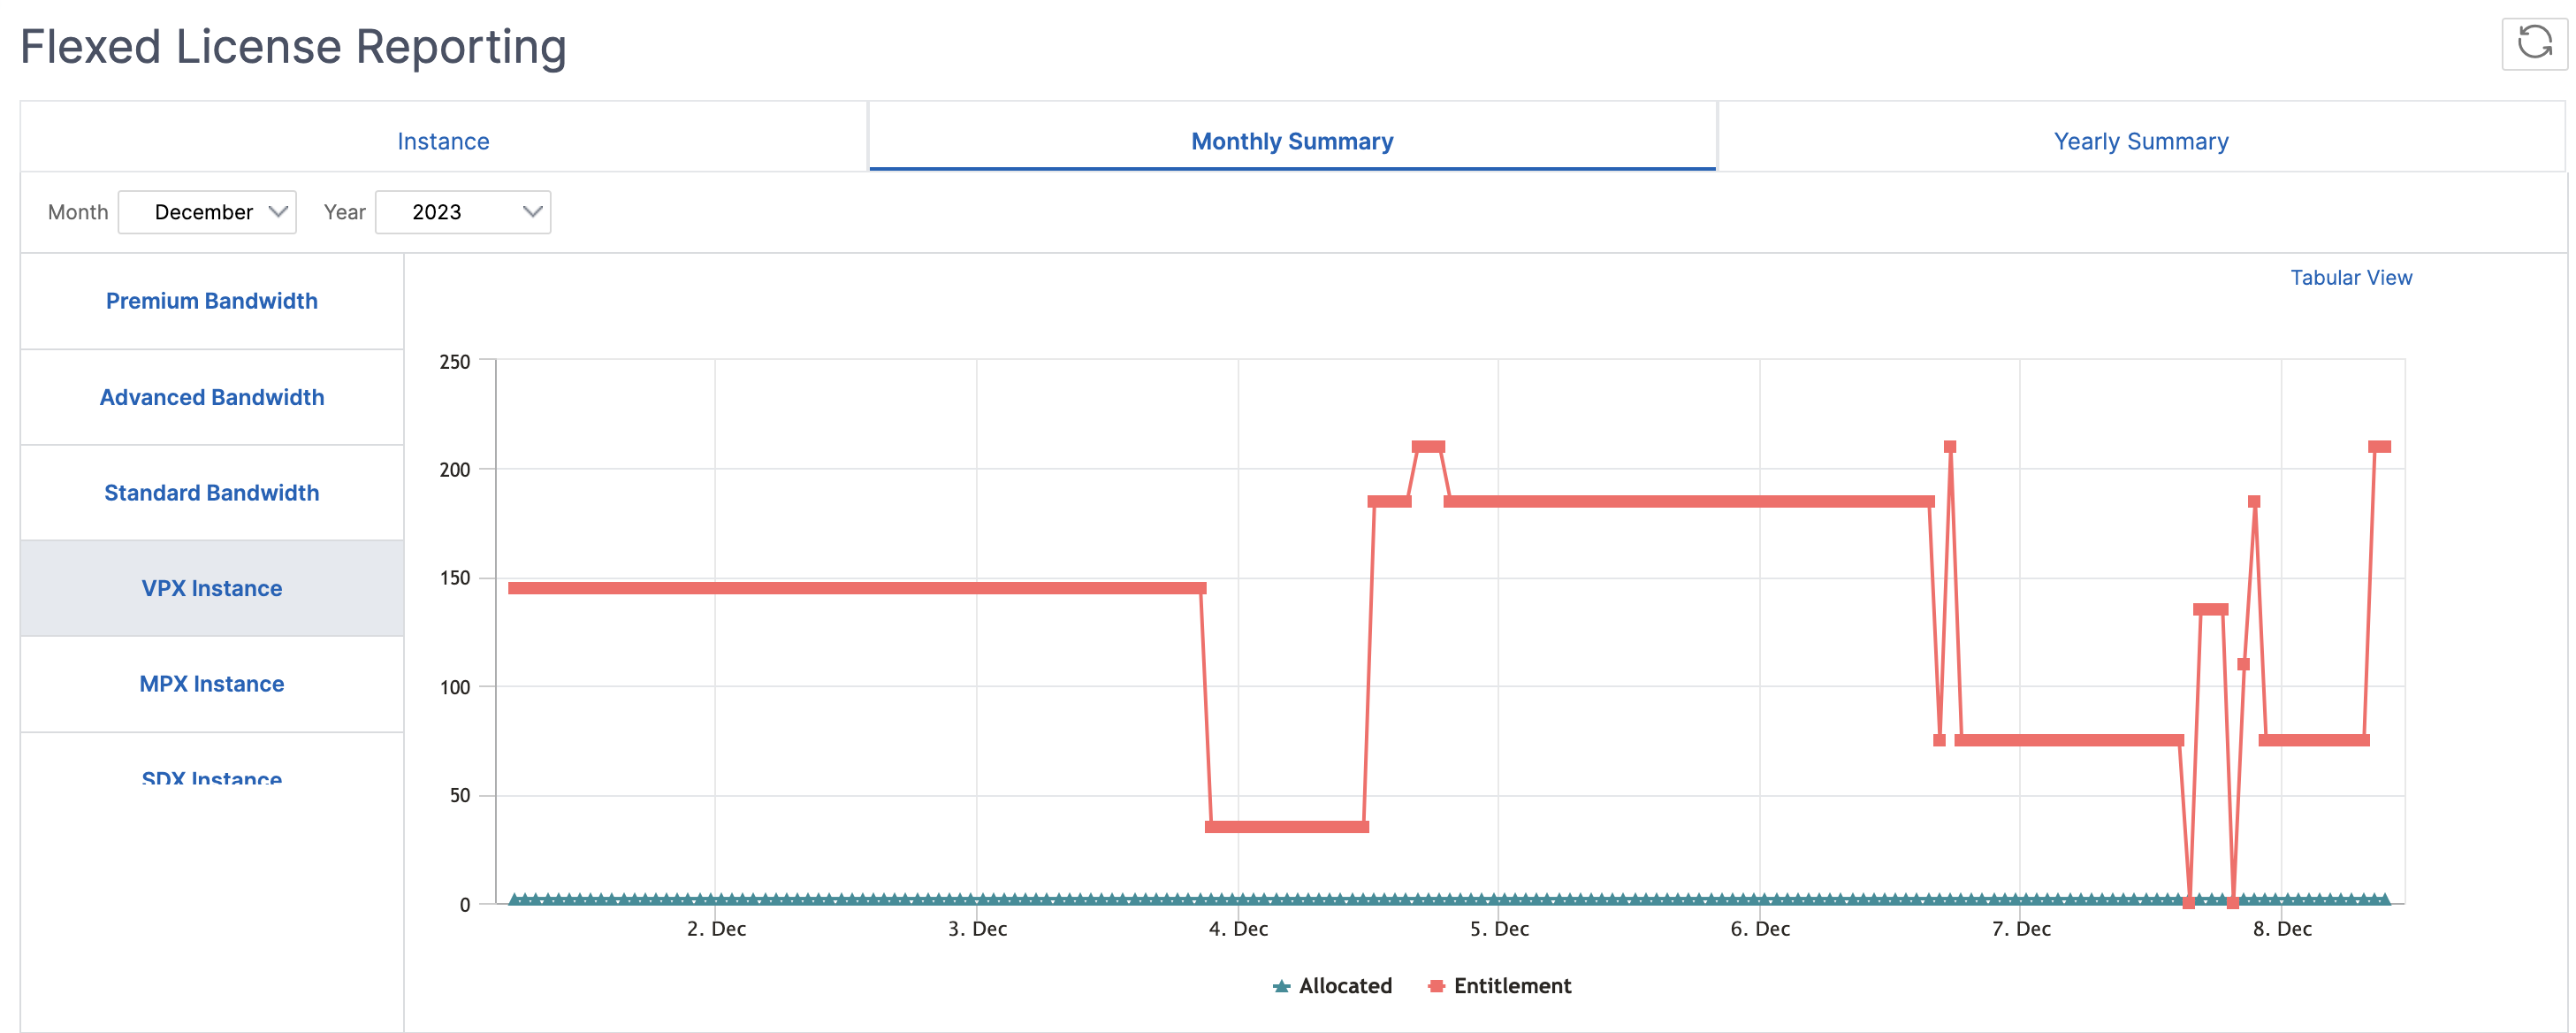
The following example shows the graphical view for the instances using Flexed license (Premium bandwidth):
Share
Share
In this article
This Preview product documentation is Cloud Software Group Confidential.
You agree to hold this documentation confidential pursuant to the terms of your Cloud Software Group Beta/Tech Preview Agreement.
The development, release and timing of any features or functionality described in the Preview documentation remains at our sole discretion and are subject to change without notice or consultation.
The documentation is for informational purposes only and is not a commitment, promise or legal obligation to deliver any material, code or functionality and should not be relied upon in making Cloud Software Group product purchase decisions.
If you do not agree, select I DO NOT AGREE to exit.