-
Low-touch onboarding of NetScaler instances using Console Advisory Connect
This content has been machine translated dynamically.
Dieser Inhalt ist eine maschinelle Übersetzung, die dynamisch erstellt wurde. (Haftungsausschluss)
Cet article a été traduit automatiquement de manière dynamique. (Clause de non responsabilité)
Este artículo lo ha traducido una máquina de forma dinámica. (Aviso legal)
此内容已经过机器动态翻译。 放弃
このコンテンツは動的に機械翻訳されています。免責事項
이 콘텐츠는 동적으로 기계 번역되었습니다. 책임 부인
Este texto foi traduzido automaticamente. (Aviso legal)
Questo contenuto è stato tradotto dinamicamente con traduzione automatica.(Esclusione di responsabilità))
This article has been machine translated.
Dieser Artikel wurde maschinell übersetzt. (Haftungsausschluss)
Ce article a été traduit automatiquement. (Clause de non responsabilité)
Este artículo ha sido traducido automáticamente. (Aviso legal)
この記事は機械翻訳されています.免責事項
이 기사는 기계 번역되었습니다.책임 부인
Este artigo foi traduzido automaticamente.(Aviso legal)
这篇文章已经过机器翻译.放弃
Questo articolo è stato tradotto automaticamente.(Esclusione di responsabilità))
Translation failed!
Application overview
The Application Overview page displays applications with full visibility into the threat details associated in both security insight and bot insight. You can also view information such as total violations, total WAF and Bot violations, violation by country, and so on.
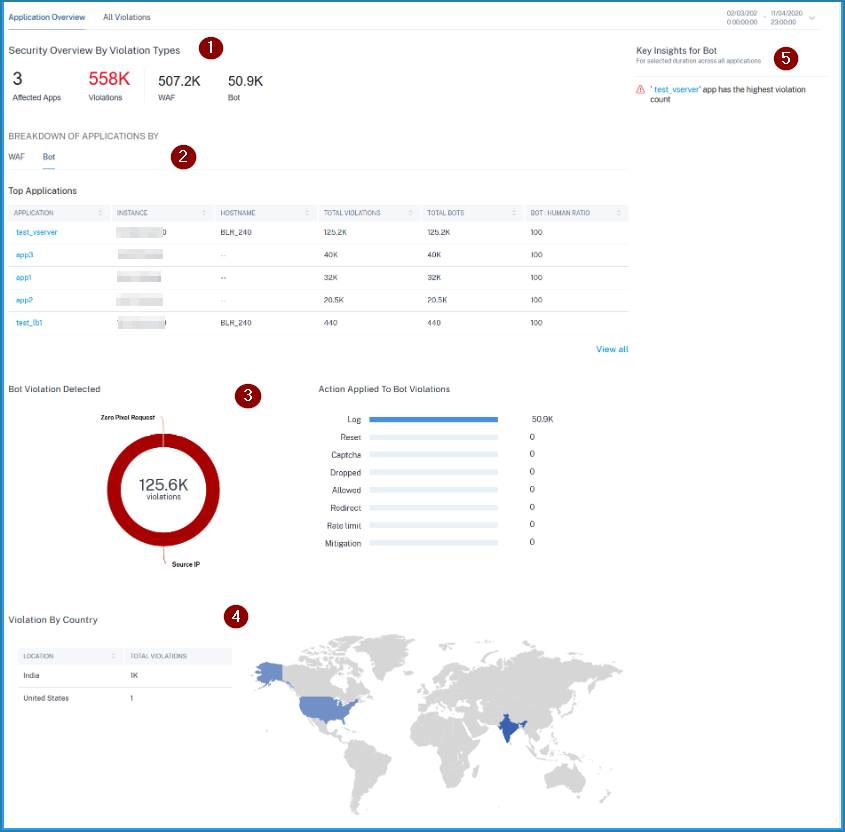
1 – Displays the total affected applications, total violations, total WAF violations, and total Bot violations for the selected duration.
2 – Displays the WAF and Bot violation details. Click the WAF and Bot tab to view the top 5 custom or discrete applications based on the total violations occurred. Click View All to view all application details.
3 – Displays the top violations based on the occurrences and the actions applied.
4 – Displays a geo map view that provides visibility from which locations the violations have occurred.
5 – Provides information based on the violations.
Violation categories
| WAF | Bot |
|---|---|
| Cookie Hijack | Scraper |
| Infer Content Type XML | Screenshot Creator |
| Buffer Overflow | Search Engine |
| Content Type | Service Agent |
| Cookie Consistency | Site Monitor |
| CSRF Form Tagging | Speed Tester |
| Deny URL | Uncategorized |
| Form Field Consistency | Virus Scanner |
| Field Formats | Vulnerability Scanner |
| Maximum Uploads | DeviceFP Wait Exceeded |
| Referrer Header | Invalid DeviceFP |
| Safe Commerce | Invalid Captcha Response |
| Safe Object | Tool |
| HTML SQL Inject | Captcha Attempts Exceeded |
| Start URL | Valid Captcha Response |
| Cross-site scripting | Captcha Client Muted |
| XML DoS | Captcha Wait Time Exceeded |
| XML Format | Request Size Limit Exceeded |
| XML WSI | Rate Limit Exceeded |
| XML SSL | Block list (IP, subnet, policy expression) |
| XML Attachment | Allow list (IP, subnet, policy expression) |
| XML SOAP Fault | Zero Pixel Request |
| XML Validation | Source IP |
| Others | Host |
| IP Reputation | Crawler |
| HTTP DOS | Feed Fetcher |
| TCP Small Window | Link Checker |
| Signature Violation | Marketing |
| File Upload Type | Geo Location |
| JSON cross-site scripting | URL |
| JSON SQL | |
| JSON DOS | |
| Command Injection | |
| Block Keyword | |
| JSON Block Keyword | |
| Command Injection Grammar | |
View WAF violation details
Click an application from the Top Applications or from the View All option to view the WAF details.

Note:
If you select a custom app, you can view the consolidated applications details in the Security Overview page. From the list, select an application to view details for the selected application.
The Security Overview page for the selected application is displayed. Under WAF, you can view:
-
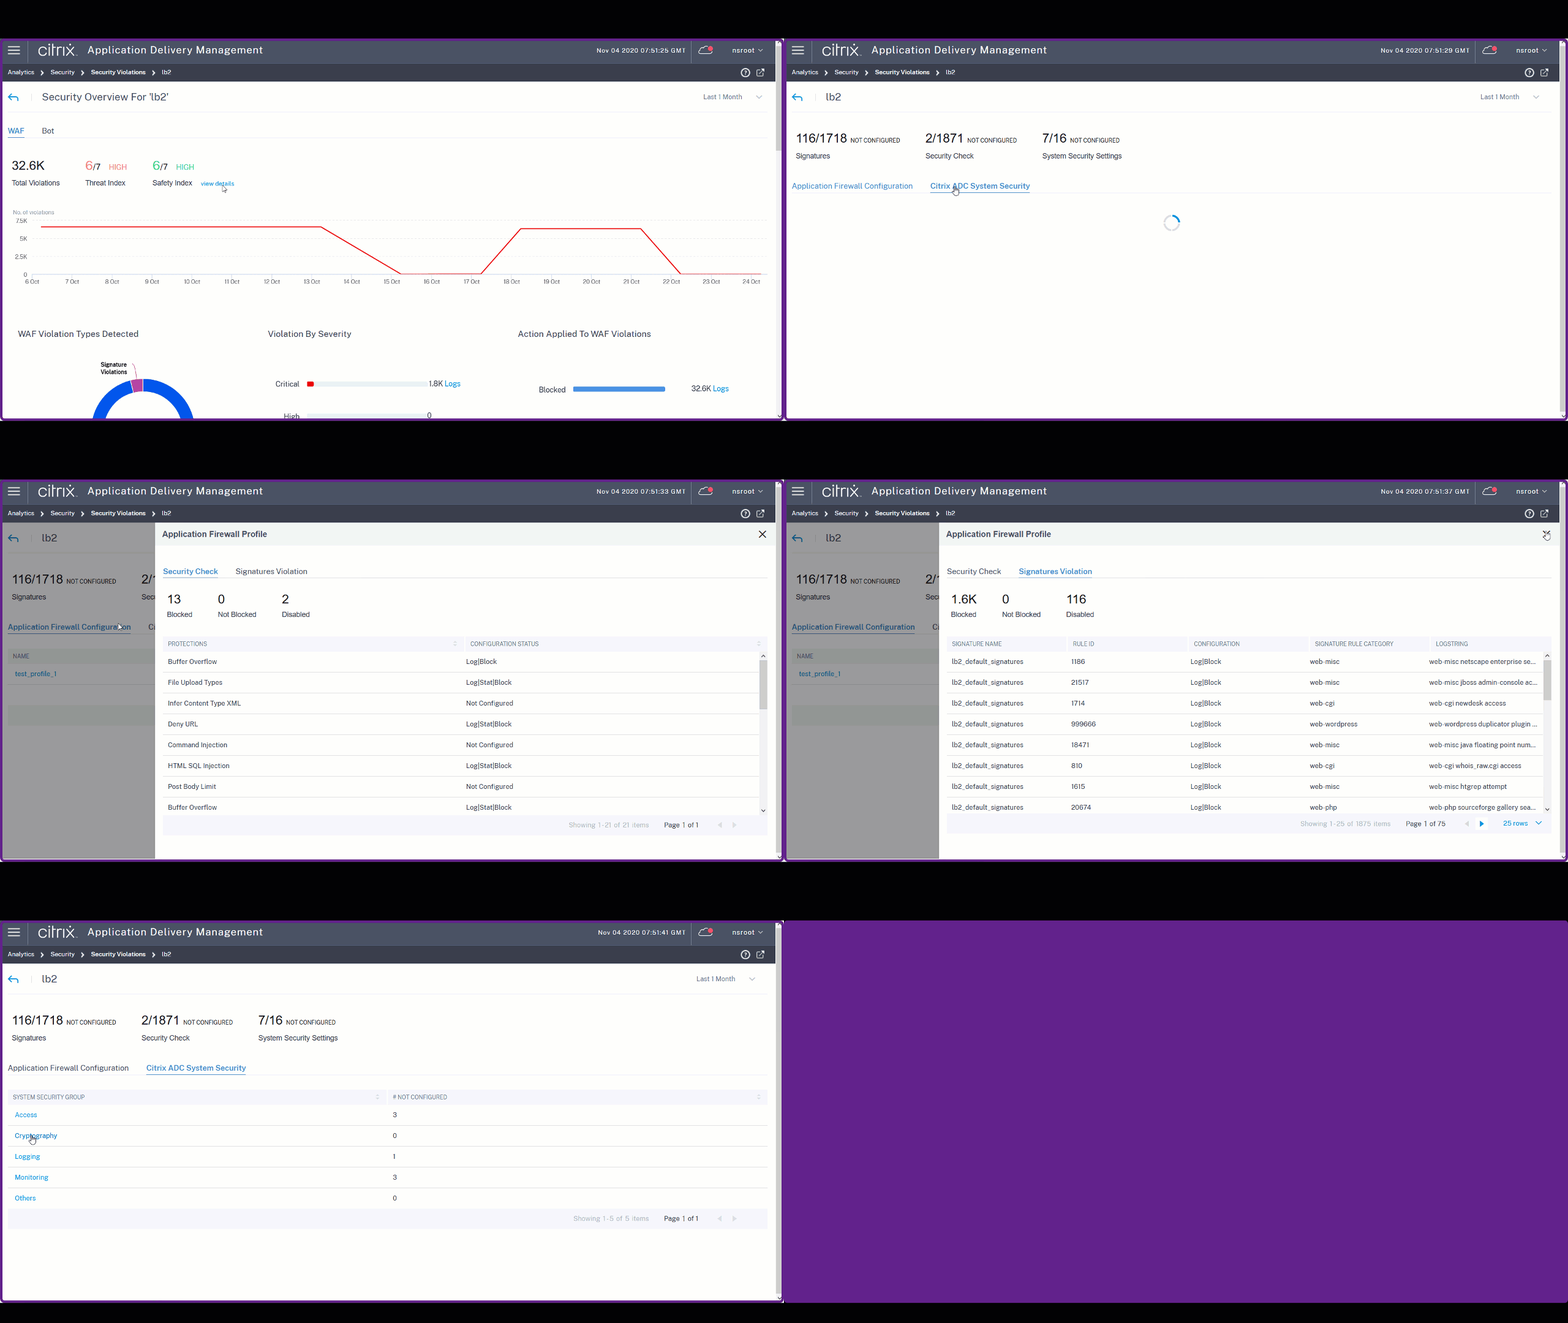
A graph view that indicates the total violations, threat index score, safety index score for the application.

Click View Details to see the Application Firewall and NetScaler System Security configuration details.
-
The violations based on types, severity, and actions applied.

Click Logs to view details based on the severity or action taken. You can also view the client IP address.

You can also use the search text box where you can view details as per your requirement. When you click the search box, the search box gives you the list of search suggestions.
-
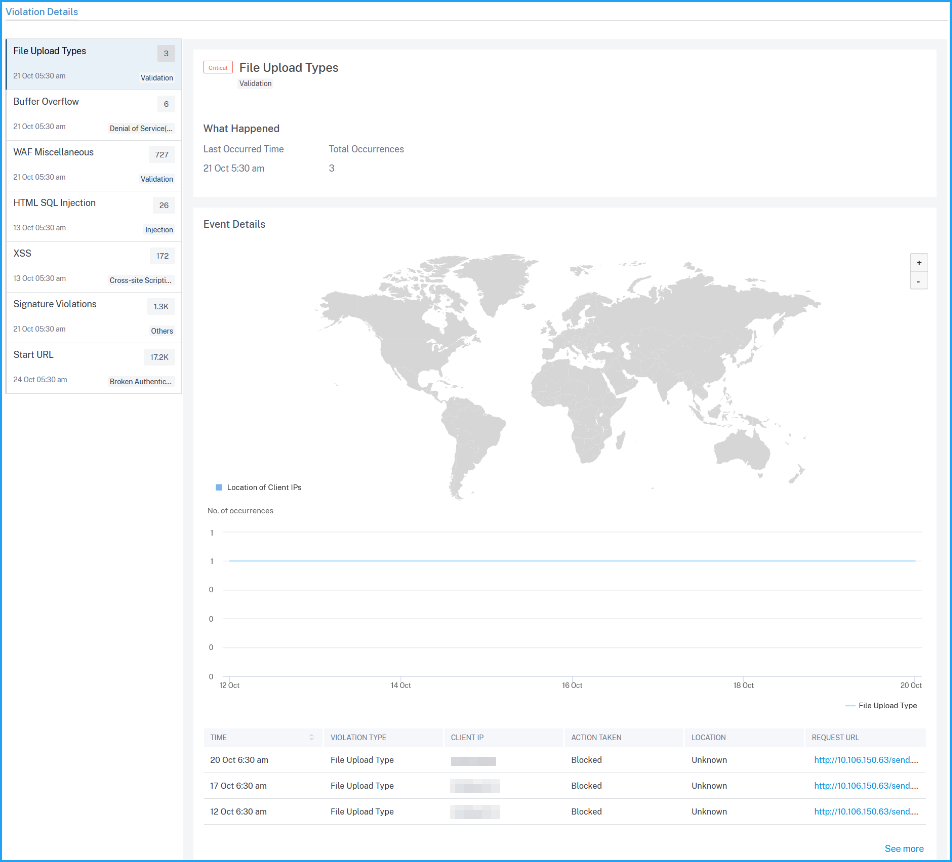
The violations affected on the application. Under Violation Details, you can view the affected violation details.
Note
For a custom app, violations that are applicable for all applications are displayed. You can click an application from the list to view the violations affected for the selected application.
Click each violation to view details such as:
-
What Happened – Indicates the total occurrences and the last occurred date and time.
-
Event Details – Displays a geo map that indicates the client IP and other violation details such as violation type, client IP, location, and so on.
-
View bot violation details
From the Bot tab, click an application from the Top Applications or from the View All option to view the bot details.

Note
If you select a custom app, you can view the consolidated applications details in the Security Overview page. From the list, select an application to view details for the selected application.
The Security Overview page for the selected application is displayed. Under Bot, you can view:
-
A graph indicating total bots, total bad bots, total good bots, and total ratio between human users and bots accessing the application.

-
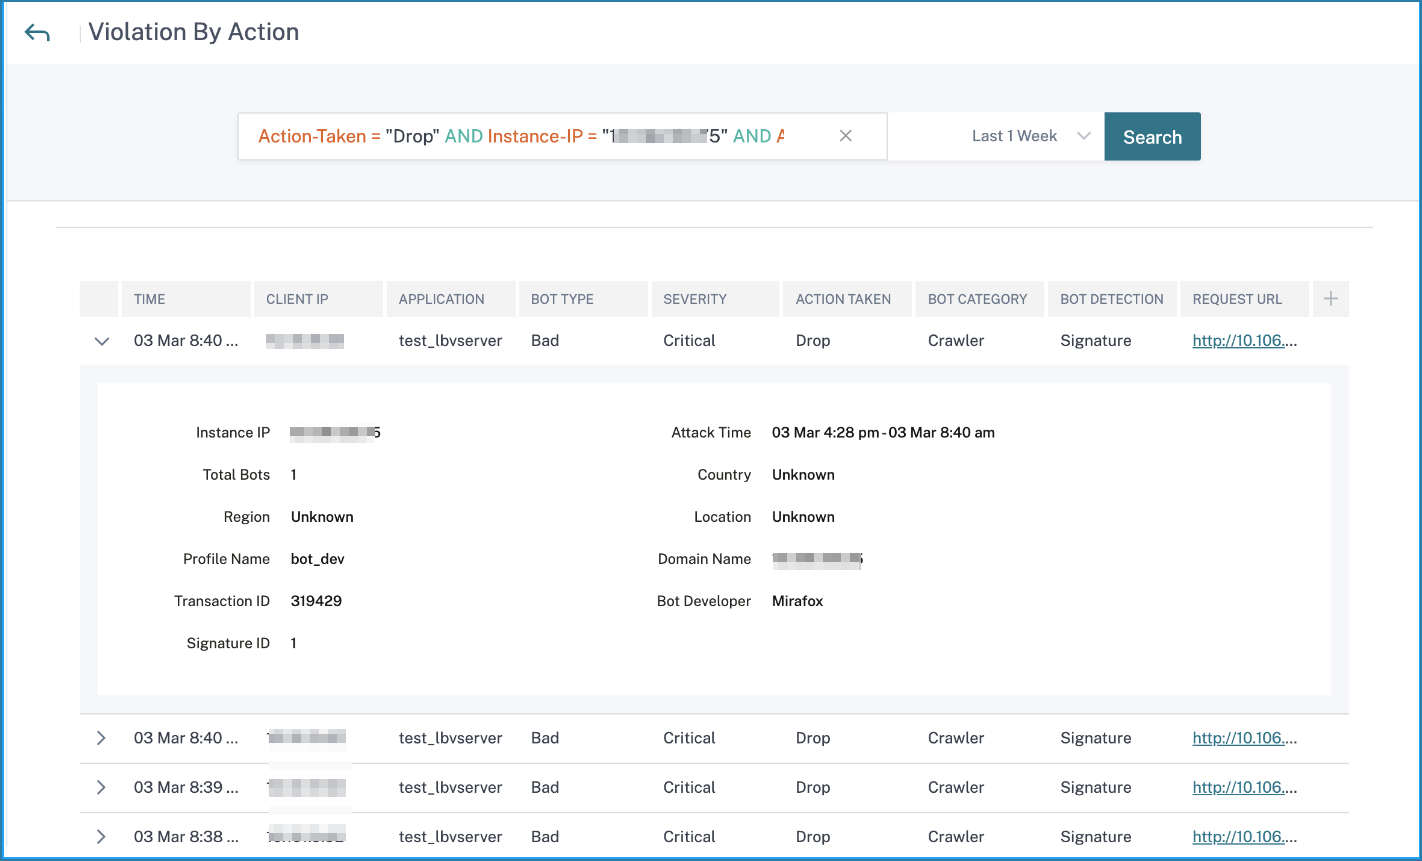
The violations based on the bot types, severity, and actions applied.

Click Logs to view details based on severity or actions taken. If a detected bot is a Signature type bot, you can view more details such as Bot developer and Signature ID. The Signature ID enables you to identify if the detected bot is a good bot or a bad bot.
Note:
If a detected bot is any other bot type apart from Signature bot, the Signature ID and Bot developer are displayed as N/A.
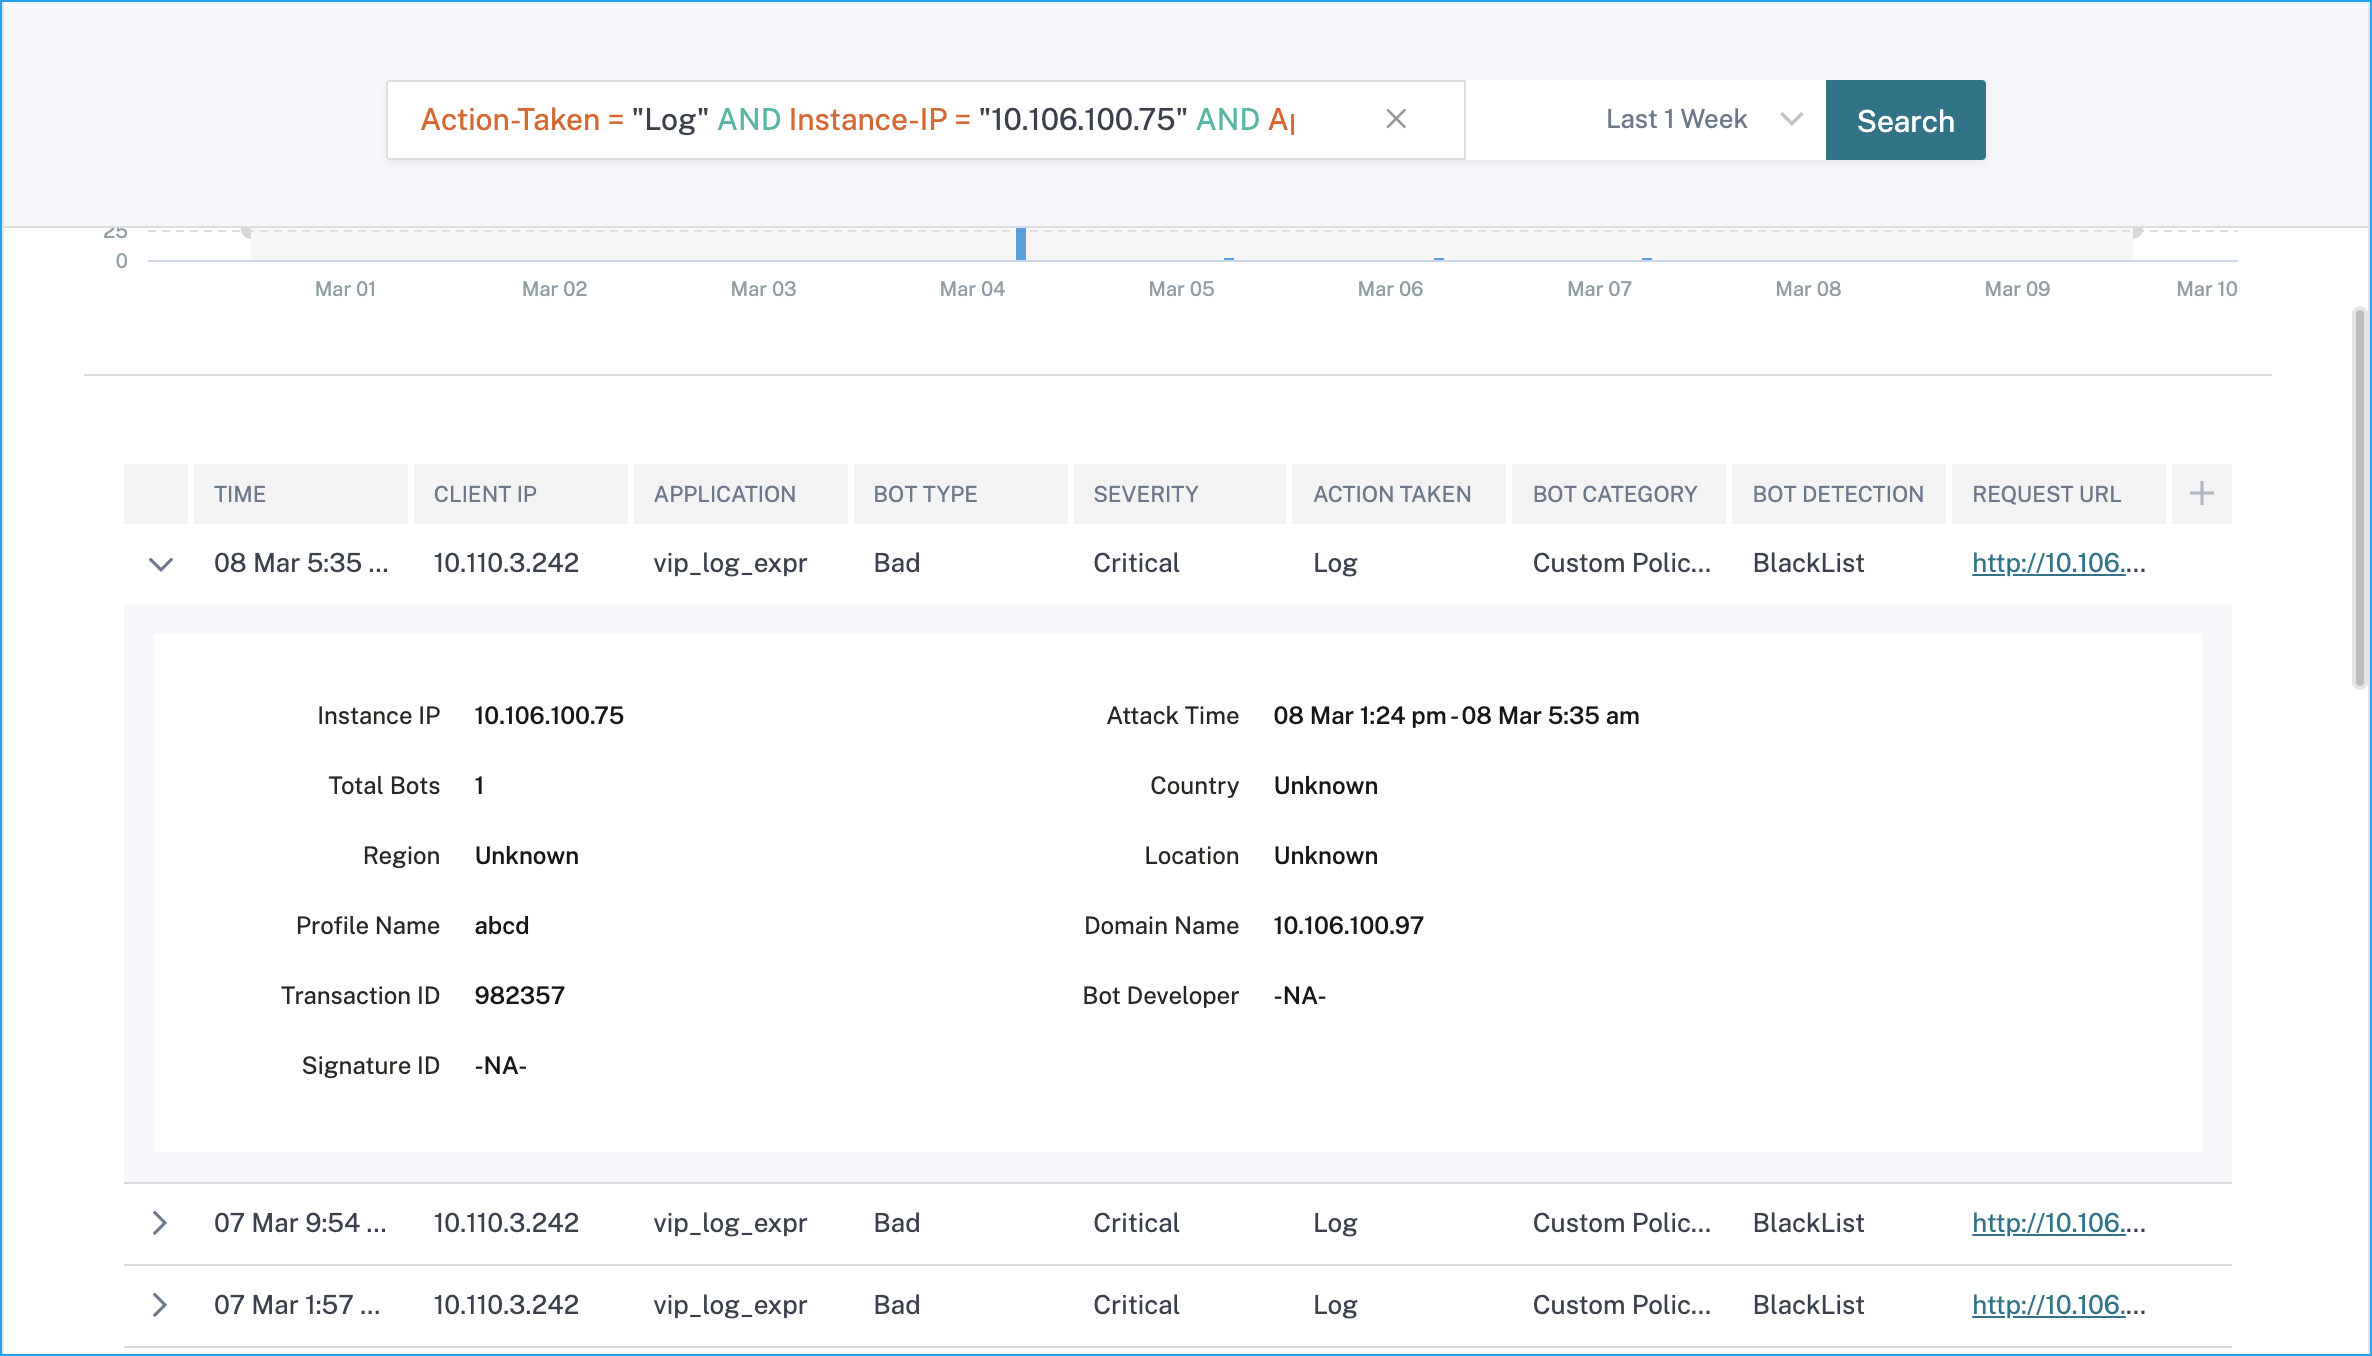
You can also use the search text box where you can view bot details as per your requirement. When you click the search box, the search box gives you the list of search suggestions.
-
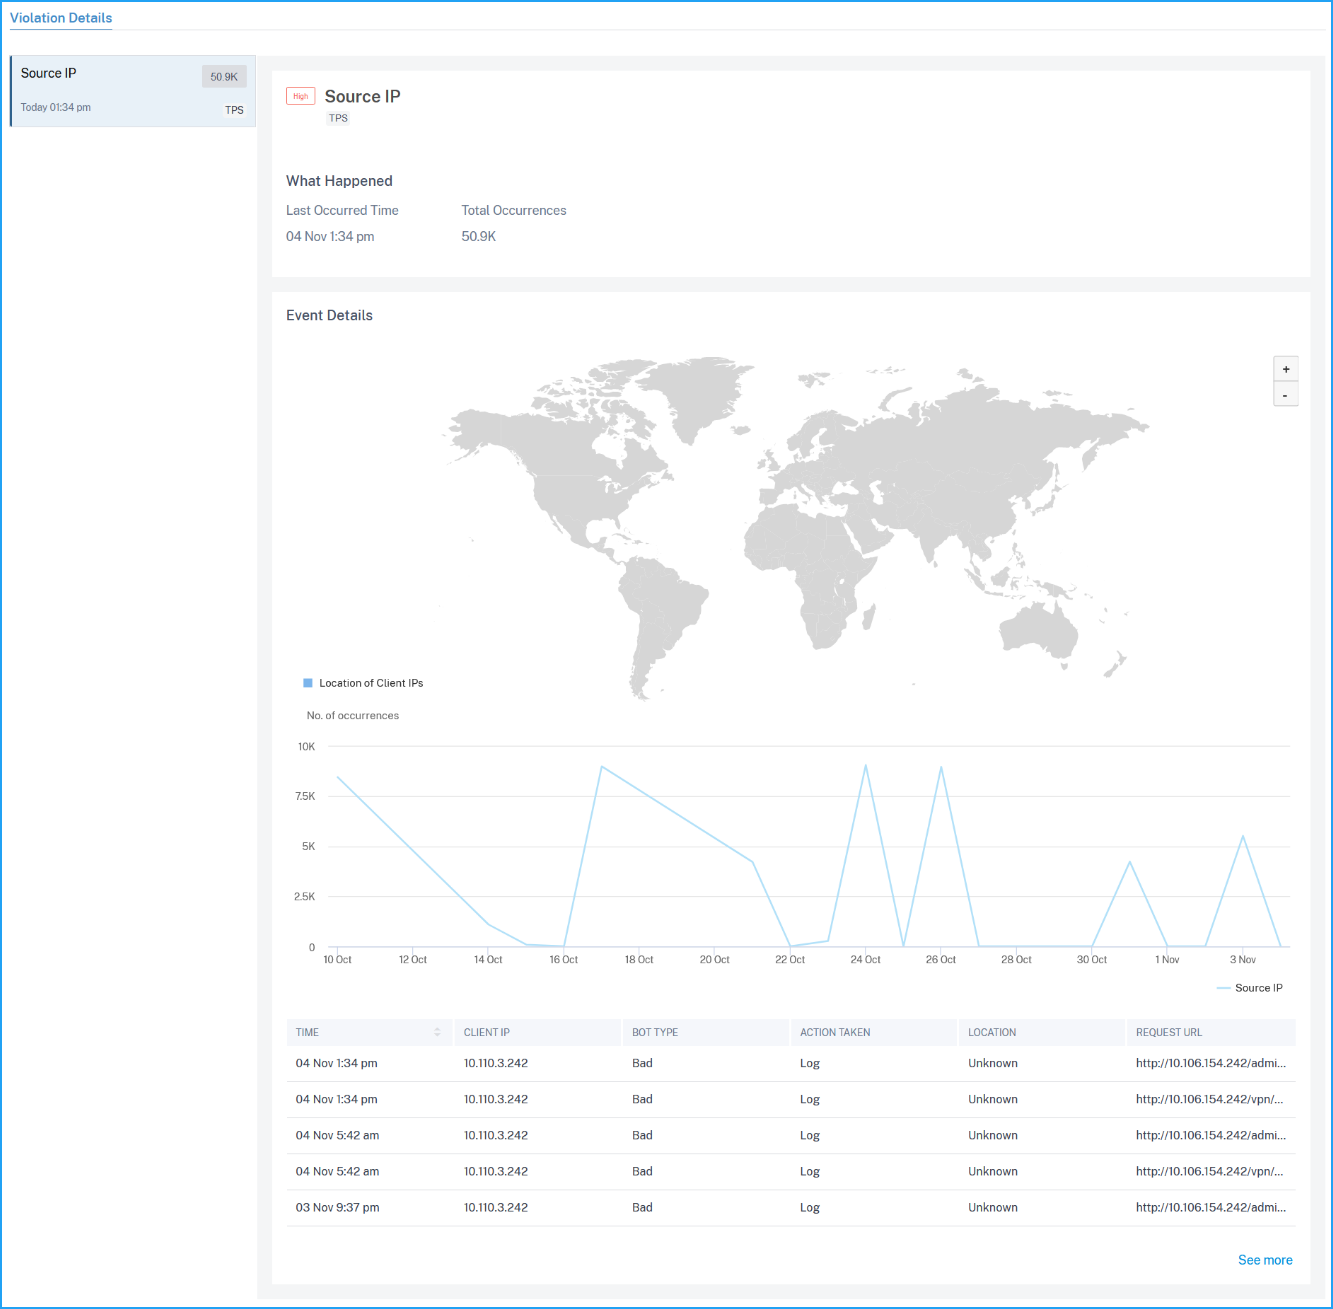
The violations affected on the application. Under Violation Details, you can view the affected violation details.
Note:
For a custom app, violations that are applicable for all applications are displayed. You can click an application from the list to view the violations affected for the selected application.
Click each violation to view details such as:
-
What Happened – Indicates the total occurrences and the last occurred date and time.
-
Event Details – Displays a geo map that indicates the client IP and other violation details such as violation type, client IP, location, and so on.
-
Note:
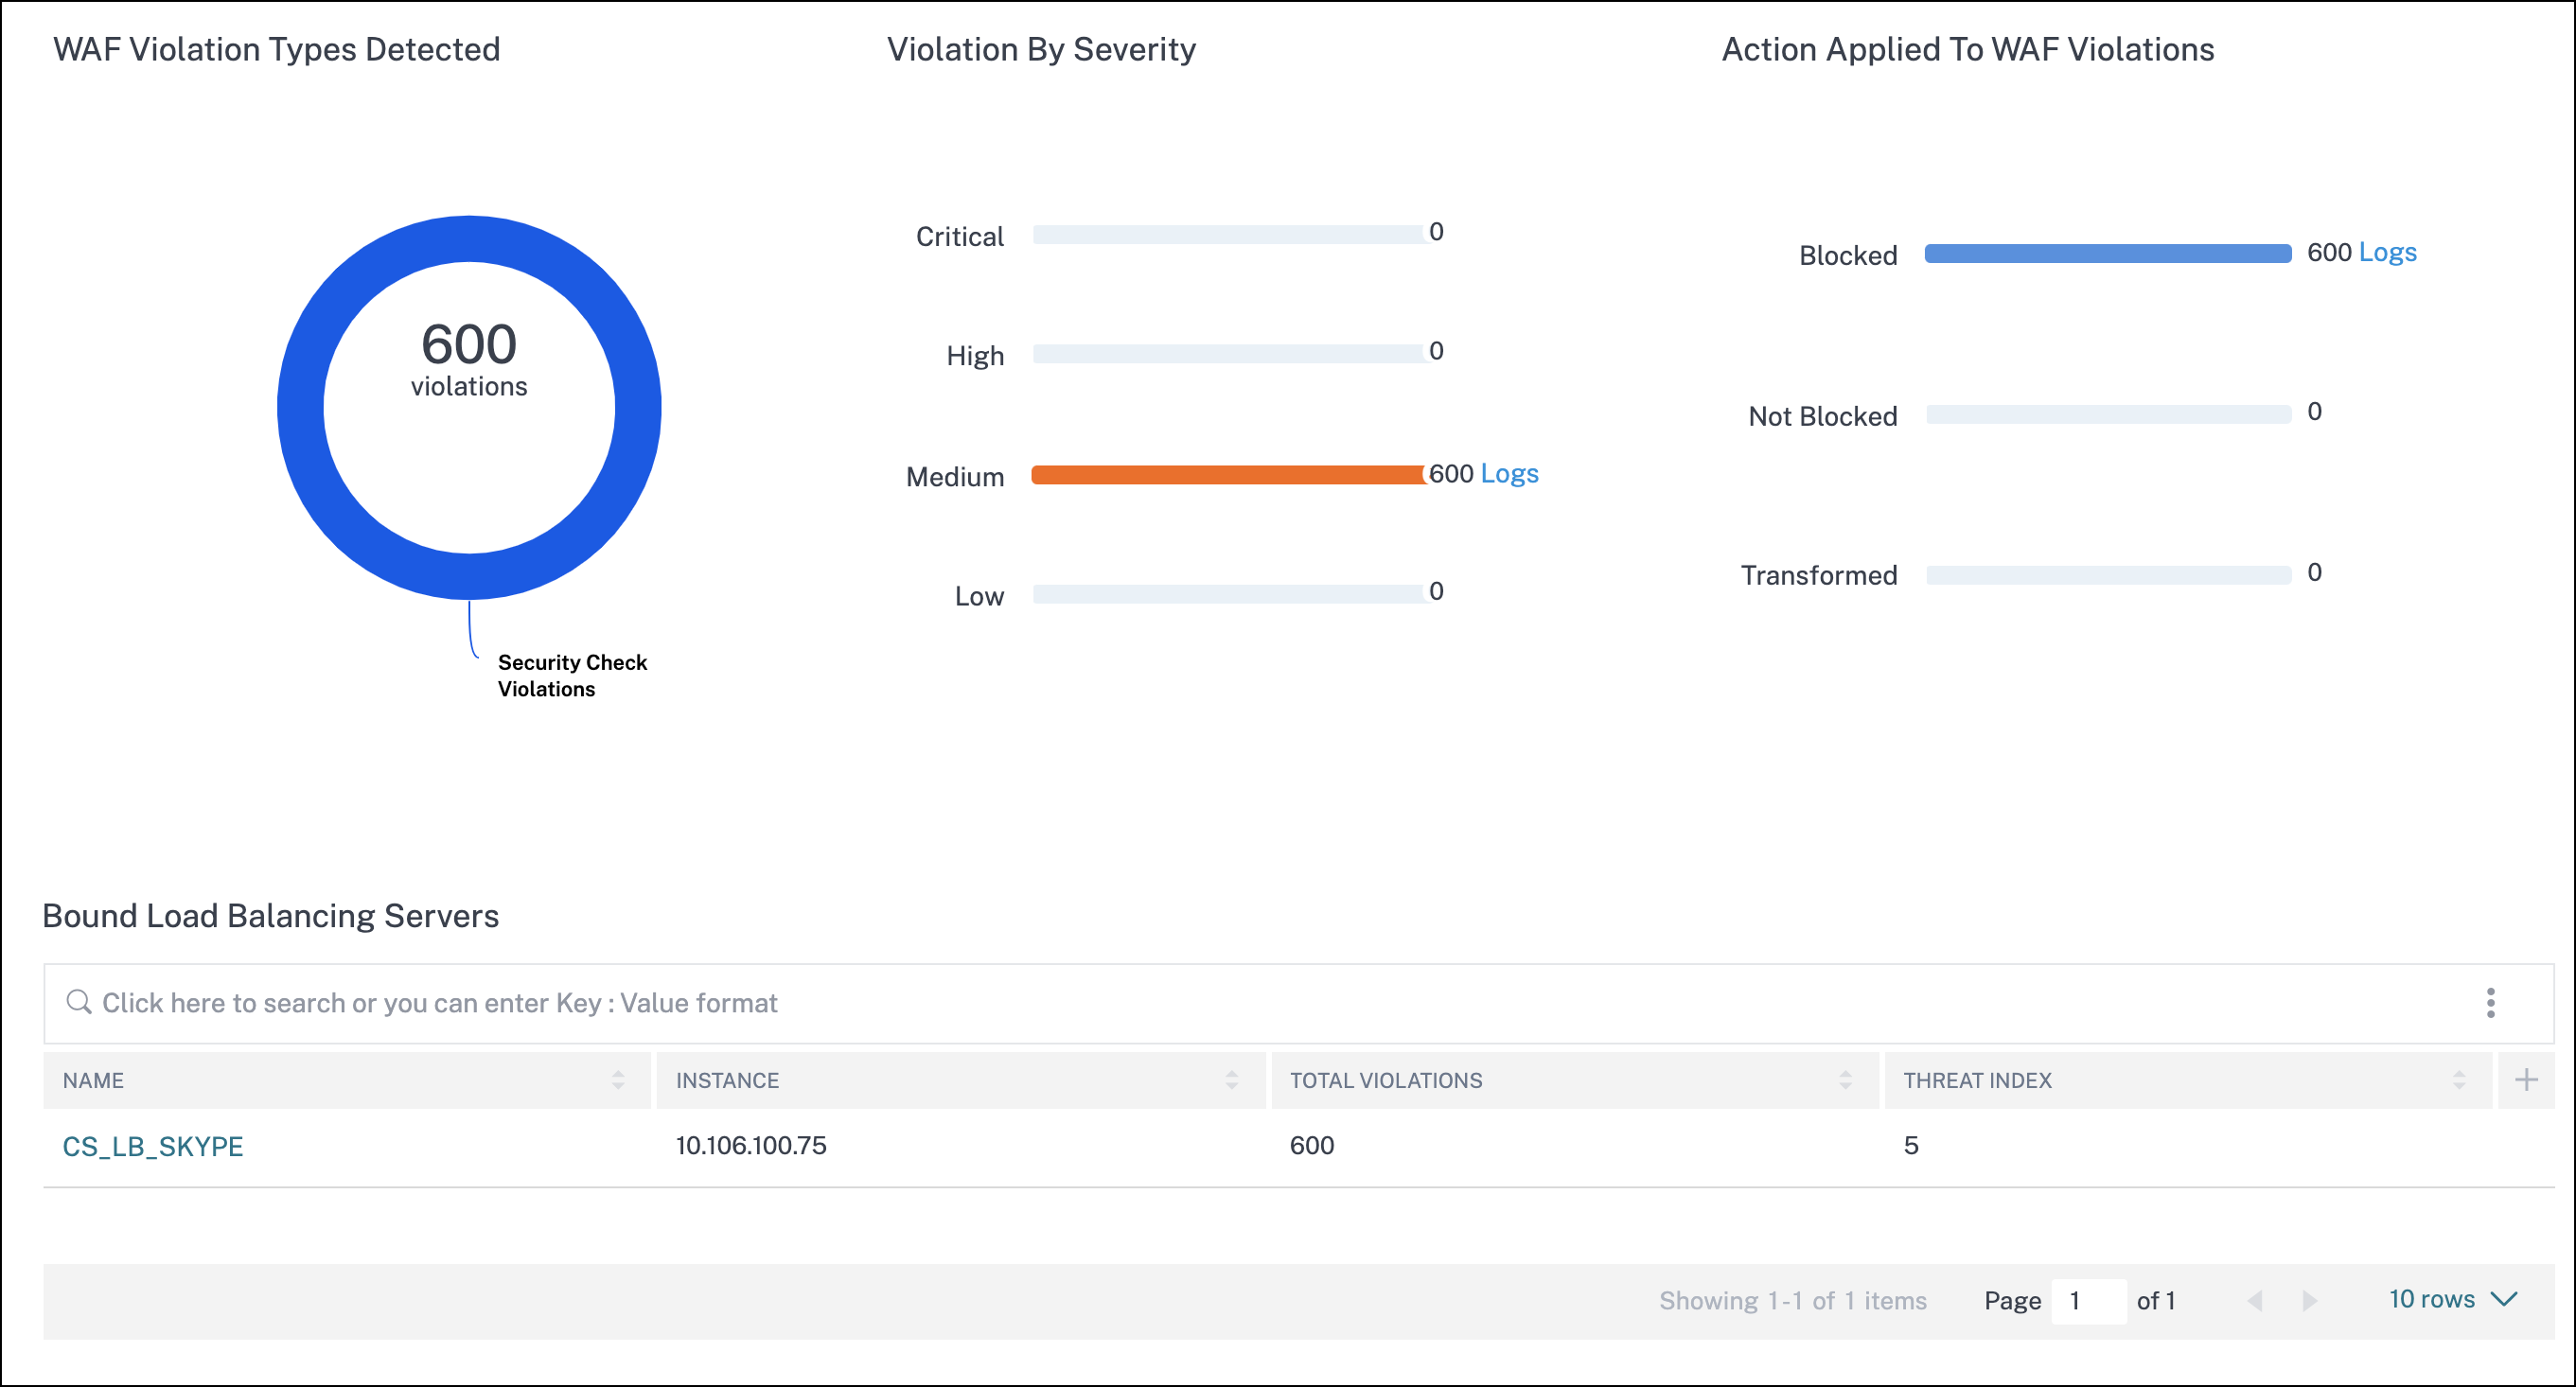
Under WAF and Bot, you can view analytics for content switching virtual server that is bound with load balancing virtual servers. Click the content switching virtual server and under Bound Load Balancing Server, you can view the list of load balancing servers bound to the content switching virtual server.
View events history
You can view the signature updates in Events, when:
-
New signatures are added in NetScaler instances.
-
Existing signatures are updated in NetScaler instances.
Signature auto update
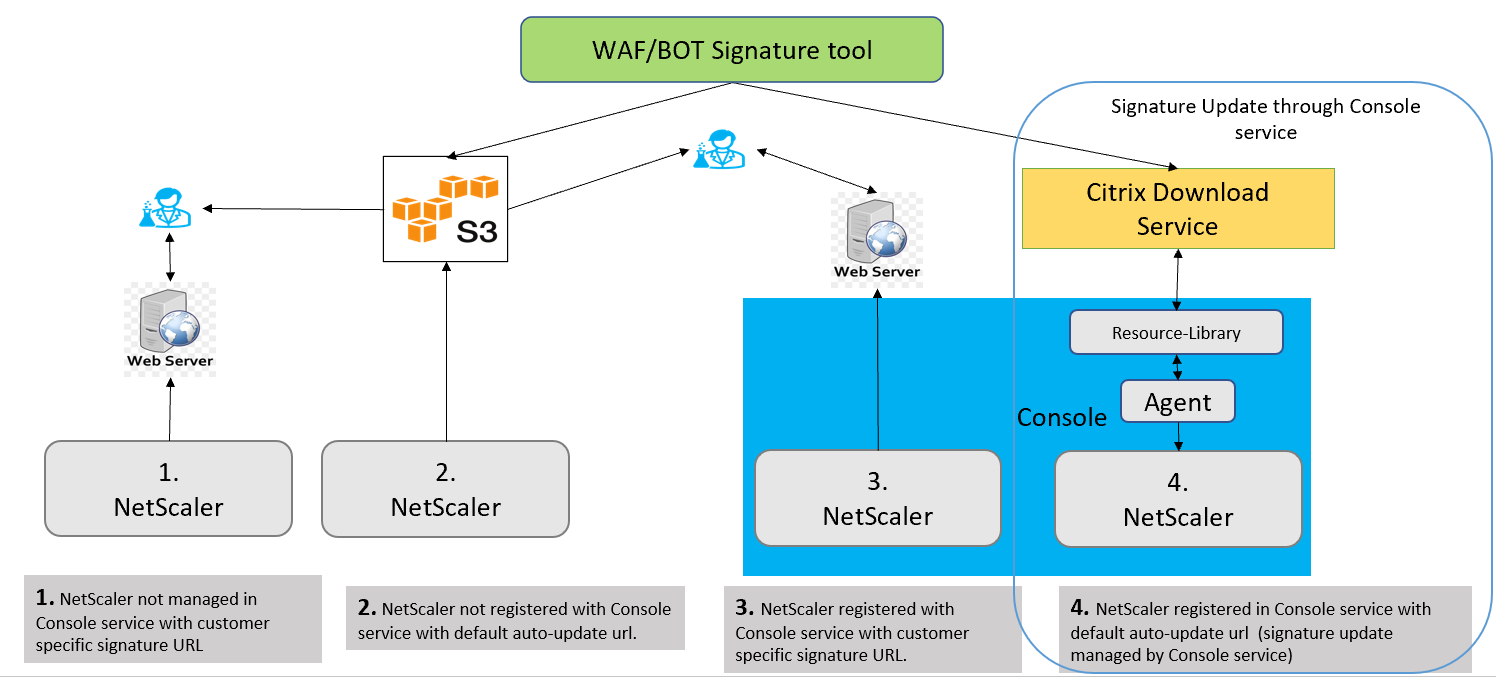
NetScaler Console automatically checks for new signature updates and applies to the managed NetScaler instances.
The following diagram shows how the signatures are retrieved from AWS cloud, updated on NetScaler and view signature update summary on NetScaler Console.
Share
Share
This Preview product documentation is Cloud Software Group Confidential.
You agree to hold this documentation confidential pursuant to the terms of your Cloud Software Group Beta/Tech Preview Agreement.
The development, release and timing of any features or functionality described in the Preview documentation remains at our sole discretion and are subject to change without notice or consultation.
The documentation is for informational purposes only and is not a commitment, promise or legal obligation to deliver any material, code or functionality and should not be relied upon in making Cloud Software Group product purchase decisions.
If you do not agree, select I DO NOT AGREE to exit.