-
Getting Started with NetScaler
-
Deploy a NetScaler VPX instance
-
Optimize NetScaler VPX performance on VMware ESX, Linux KVM, and Citrix Hypervisors
-
Apply NetScaler VPX configurations at the first boot of the NetScaler appliance in cloud
-
Configure simultaneous multithreading for NetScaler VPX on public clouds
-
Install a NetScaler VPX instance on Microsoft Hyper-V servers
-
Install a NetScaler VPX instance on Linux-KVM platform
-
Prerequisites for installing NetScaler VPX virtual appliances on Linux-KVM platform
-
Provisioning the NetScaler virtual appliance by using OpenStack
-
Provisioning the NetScaler virtual appliance by using the Virtual Machine Manager
-
Configuring NetScaler virtual appliances to use SR-IOV network interface
-
Configure a NetScaler VPX on KVM hypervisor to use Intel QAT for SSL acceleration in SR-IOV mode
-
Configuring NetScaler virtual appliances to use PCI Passthrough network interface
-
Provisioning the NetScaler virtual appliance by using the virsh Program
-
Provisioning the NetScaler virtual appliance with SR-IOV on OpenStack
-
Configuring a NetScaler VPX instance on KVM to use OVS DPDK-Based host interfaces
-
-
Deploy a NetScaler VPX instance on AWS
-
Deploy a VPX high-availability pair with elastic IP addresses across different AWS zones
-
Deploy a VPX high-availability pair with private IP addresses across different AWS zones
-
Protect AWS API Gateway using the NetScaler Web Application Firewall
-
Configure a NetScaler VPX instance to use SR-IOV network interface
-
Configure a NetScaler VPX instance to use Enhanced Networking with AWS ENA
-
Deploy a NetScaler VPX instance on Microsoft Azure
-
Network architecture for NetScaler VPX instances on Microsoft Azure
-
Configure multiple IP addresses for a NetScaler VPX standalone instance
-
Configure a high-availability setup with multiple IP addresses and NICs
-
Configure a high-availability setup with multiple IP addresses and NICs by using PowerShell commands
-
Deploy a NetScaler high-availability pair on Azure with ALB in the floating IP-disabled mode
-
Configure a NetScaler VPX instance to use Azure accelerated networking
-
Configure HA-INC nodes by using the NetScaler high availability template with Azure ILB
-
Configure a high-availability setup with Azure external and internal load balancers simultaneously
-
Configure a NetScaler VPX standalone instance on Azure VMware solution
-
Configure a NetScaler VPX high availability setup on Azure VMware solution
-
Configure address pools (IIP) for a NetScaler Gateway appliance
-
Deploy a NetScaler VPX instance on Google Cloud Platform
-
Deploy a VPX high-availability pair on Google Cloud Platform
-
Deploy a VPX high-availability pair with external static IP address on Google Cloud Platform
-
Deploy a single NIC VPX high-availability pair with private IP address on Google Cloud Platform
-
Deploy a VPX high-availability pair with private IP addresses on Google Cloud Platform
-
Install a NetScaler VPX instance on Google Cloud VMware Engine
-
-
Solutions for Telecom Service Providers
-
Load Balance Control-Plane Traffic that is based on Diameter, SIP, and SMPP Protocols
-
Provide Subscriber Load Distribution Using GSLB Across Core-Networks of a Telecom Service Provider
-
Authentication, authorization, and auditing application traffic
-
Basic components of authentication, authorization, and auditing configuration
-
Web Application Firewall protection for VPN virtual servers and authentication virtual servers
-
On-premises NetScaler Gateway as an identity provider to Citrix Cloud™
-
Authentication, authorization, and auditing configuration for commonly used protocols
-
Troubleshoot authentication and authorization related issues
-
-
-
-
-
-
Configure DNS resource records
-
Configure NetScaler as a non-validating security aware stub-resolver
-
Jumbo frames support for DNS to handle responses of large sizes
-
Caching of EDNS0 client subnet data when the NetScaler appliance is in proxy mode
-
Use case - configure the automatic DNSSEC key management feature
-
Use Case - configure the automatic DNSSEC key management on GSLB deployment
-
-
-
Persistence and persistent connections
-
Advanced load balancing settings
-
Gradually stepping up the load on a new service with virtual server–level slow start
-
Protect applications on protected servers against traffic surges
-
Retrieve location details from user IP address using geolocation database
-
Use source IP address of the client when connecting to the server
-
Use client source IP address for backend communication in a v4-v6 load balancing configuration
-
Set a limit on number of requests per connection to the server
-
Configure automatic state transition based on percentage health of bound services
-
-
Use case 2: Configure rule based persistence based on a name-value pair in a TCP byte stream
-
Use case 3: Configure load balancing in direct server return mode
-
Use case 6: Configure load balancing in DSR mode for IPv6 networks by using the TOS field
-
Use case 7: Configure load balancing in DSR mode by using IP Over IP
-
Use case 10: Load balancing of intrusion detection system servers
-
Use case 11: Isolating network traffic using listen policies
-
Use case 12: Configure Citrix Virtual Desktops for load balancing
-
Use case 13: Configure Citrix Virtual Apps and Desktops for load balancing
-
Use case 14: ShareFile wizard for load balancing Citrix ShareFile
-
Use case 15: Configure layer 4 load balancing on the NetScaler appliance
-
-
-
Monitor NetScaler and applications using Prometheus
-
-
-
-
Authentication and authorization for System Users
-
-
-
Configuring a CloudBridge Connector Tunnel between two Datacenters
-
Configuring CloudBridge Connector between Datacenter and AWS Cloud
-
Configuring a CloudBridge Connector Tunnel Between a Datacenter and Azure Cloud
-
Configuring CloudBridge Connector Tunnel between Datacenter and SoftLayer Enterprise Cloud
-
Configuring a CloudBridge Connector Tunnel Between a NetScaler Appliance and Cisco IOS Device
-
CloudBridge Connector Tunnel Diagnostics and Troubleshooting
This content has been machine translated dynamically.
Dieser Inhalt ist eine maschinelle Übersetzung, die dynamisch erstellt wurde. (Haftungsausschluss)
Cet article a été traduit automatiquement de manière dynamique. (Clause de non responsabilité)
Este artículo lo ha traducido una máquina de forma dinámica. (Aviso legal)
此内容已经过机器动态翻译。 放弃
このコンテンツは動的に機械翻訳されています。免責事項
이 콘텐츠는 동적으로 기계 번역되었습니다. 책임 부인
Este texto foi traduzido automaticamente. (Aviso legal)
Questo contenuto è stato tradotto dinamicamente con traduzione automatica.(Esclusione di responsabilità))
This article has been machine translated.
Dieser Artikel wurde maschinell übersetzt. (Haftungsausschluss)
Ce article a été traduit automatiquement. (Clause de non responsabilité)
Este artículo ha sido traducido automáticamente. (Aviso legal)
この記事は機械翻訳されています.免責事項
이 기사는 기계 번역되었습니다.책임 부인
Este artigo foi traduzido automaticamente.(Aviso legal)
这篇文章已经过机器翻译.放弃
Questo articolo è stato tradotto automaticamente.(Esclusione di responsabilità))
Translation failed!
Monitor NetScaler, applications, and application security using Prometheus
Metrics are a numeric representation of data that are measured over a certain period of time. Metric data is useful to track the health of a system over time. Prometheus is an open-source monitoring tool that collects metrics data and stores that data with a time stamp at which the data was recorded.
By monitoring and analyzing metrics, you can track the health of your applications, detect any anomalies, create alerts, and take necessary corrective actions to ensure robust software delivery.
NetScaler now supports directly exporting metrics to Prometheus. You can use the rich set of metrics provided by NetScaler ADC to monitor NetScaler health as well as application health. For example, you can gather metrics on CPU and memory usage to know the NetScaler health. Similarly, you can use metrics like the number of HTTP requests received per second or the number of active clients to monitor application health.
Export of metrics from NetScaler to Prometheus
NetScaler supports the Prometheus pull mode and push mode. In the pull mode, you need to configure a time series profile that Prometheus queries at regular intervals and pulls the metrics data directly without an exporter resource in between. With pull mode, you can enable read-only access for a user without superuser privileges to export metrics to Prometheus. Using Grafana, you can visualize the NetScaler metrics exported to Prometheus for easier interpretation and understanding.
When push mode is configured, NetScaler uses the default endpoint URL. The default endpoint URL looks like /metrics/job/ns_nsip. The following is a sample push configuration:
POST /metrics/job/ns_10.146.77.101 HTTP/1.1
HOST: 127.0.0.2:5563
Content-Type:  application/line/prom
Content-Length: 671745
Metrics-Payload-Id: 1731647418
Metrics-Chunk-Info: chunk-id=1;total-chunks=1
X-Appflow-Id: 10.146.77.101
<!--NeedCopy-->
Starting from NetScaler 14.1-43.x release, NetScaler uses the endpoint URL configured in the metrics profile to push the configuration For example, https://specificurl.ms.com/api/v1/push.
For example, if the metrics profile is configured with set metrics profile ns_metrics_profile -metricsEndpointUrl "/api/v1/metrics" -metricsAuthToken "cbnekwncklmwncklmewn", then /api/v1/metrics is taken as the endpoint URL.
Starting from NetScaler 14.1-51.x release, you can export metrics from the secondary node in a High Availability (HA) environment. The secondary node supports both push and pull mode of operation.
Since the secondary node is passive and does not handle data traffic, its data-related counters are not present. However, the metrics that report the node’s health and state are available. When a new schema file is created or modified on the primary node, the changes are automatically synced to the secondary node.
The following entities can be monitored on the secondary node:
Cluster_instanceCluster_nodeInterfaceNetscalerCpuMempoolVlan-
partitionTo verify the Prometheus PULL mode with cURL, run the following command:
curl http://<IP>/metrics?profilename=<profile_name> -u <username>:<password>
If you do not specify the profile name, NetScaler considers the default profile, ns_analytics_time_series_profile as the profile name. When you are using the default profile, run the following command:
curl http://<IP>/metrics -u <username>:<password>
Both metrics profile and analytics profile support Prometheus PULL mode with cURL. However, we recommend you to use the metrics profile. By using a metrics profile, you fine-tune your metrics export by selecting specific entities like virtual servers, services, and service groups associated with a metrics profile in NetScaler.
The following diagram shows a Prometheus and Grafana integration with NetScaler.

Configure the export of metrics from NetScaler to Prometheus and visualization using Grafana
You must perform the following steps to configure the export of metrics from NetScaler to Prometheus and visualize it using Grafana.
- Configure NetScaler with a time series analytics profile or configure a metrics profile for exporting metrics to Prometheus.
- Install prometheus and configure it with the NetScaler specific parameters.
- Configure read-only Prometheus access for a non-super user.
- Add Prometheus as a data source in Grafana.
- Create visualization in Grafana.
Configure a time series analytics profile on NetScaler to support the Prometheus pull mode
Do the following steps for configuring pull mode using the NetScaler CLI:
-
Create an analytics profile with type as time series. Specify the schema file with the required NetScaler metrics.
 add analytics profile <timeseries_profile_name> -type timeseries -schemaFile <name_of_schema_file> -outputMode Prometheus -serveMode PULL -metrics ENABLED
<!--NeedCopy-->
In this command:
-
timeseries_profile_name: Specify the time series profile name. -
schemaFile: Specify the name of the schema file with NetScaler counters. By default, a schema file/var/metrics_conf/schema.jsonwith a list of counters is configured. A reference schema filereference_schema.jsonwith all the supported counters is also available under the path/var/metrics_conf/. This schema file can be used as a reference to build a custom list of counters. When you specify the schema file, the path of the schema file/var/metrics_conf/is automatically added and you need to mention only the schema file name. For example, if you have created a schema fileschema1.jsonwith a custom list of counters at/var/metrics_conf/, you need to specify only the file name asschema1.json.Note:
-
If the
ratefield in schema.json is set toTrue, then a counter calledRATE__<counter_name>is exported by metricscollector as part of metrics payload. -
Do not configure the following string counters because they are not supported for Prometheus:
- si_peer_ip_str
- cl_cur_vleader
- cl_cur_nodeip
- gslb_site_ip_str
- gslb_site_publicip_str
- vsvr_IPstr
- nic_cur_if_alias
- vsvr_DynamicProtocolStr
- api_endpoint_apiname
-
-
outputMode: Set the output mode as Prometheus. -
serveMode: Specify Prometheus pull mode. -
metrics: Enable collecting metrics from NetScaler.
Note:
You can configure an analytics profile with all the necessary parameters using the add command. If you need to make changes after creating the profile, you can use the set command to take the appropriate action such as disabling metrics and changing the server mode. You can configure read-only Prometheus access for a non-super user. For more information, see configure read-only Prometheus access for a non-superuser.
-
Install and configure Prometheus for metrics export from NetScaler
You can download Prometheus from repositories such as DockerHub or Quay or the official Prometheus repository.
To run Prometheus as a Docker container use the following command:
docker run -dp 39090:9090 -v /tmp/prometheus.yml:/etc/prometheus/prometheus.yml --name native_prom prom/prometheus:latest
<!--NeedCopy-->
Note:
Here,
/tmp/prometheus.ymlis used as the path to theprometheus.ymlfile. Instead of that, you can specify the path on your virtual machine.
You must edit the prometheus.yml with the NetScaler parameters.
To export metrics from NetScaler, you must specify the following NetScaler specific parameters in the Prometheus YAML scrape configuration section. The scrape configuration section specifies a set of targets and configuration parameters describing how to scrape them.
-
metrics_path: Specify the HTTP resource path in NetScaler to fetch metrics. This parameter is optional and the default path is/metrics. If there is no value defined, then Prometheus adds “/metrics” as the path. -
username: Specify the NetScaler user name. -
password: Specify the NetScaler password. -
targets: Specify the IP address of the NetScaler from which you need to export the metrics and the port you want to expose. -
profilename: Specify the name of the profile in place ofprofilename. Theprofilenameparameter is optional and accepts a user-defined time series profile name. Ifprofile nameparameter is absent, thenns_analytics_time_series_profileis considered as the profile name. -
follow_redirects: Configure whether HTTP requests follow HTTP 3xx redirects. This parameter is optional and default value is set totrueby Prometheus. If you are configuruing this parameter, then you must set the value totrue.
Following is the scrap configuration section of the Prometheus YAML to add the NetScaler IP address as a target on Prometheus to export metrics. Here, HTTP is used as the scheme. You can use either HTTP or HTTPS.
  scrape_configs:
    - job_name: 'vpx2_metrics_direct'
      metrics_path: /metrics
      params:
        profilename:
        - 'profile_name'
      basic_auth:
        username: 'prom_user'
        password: 'user_password'
      scheme: http
      scrape_interval: 30s
      follow_redirects: true
      static_configs:
      - targets: ['10.102.34.231:80']
<!--NeedCopy-->
Configure read-only Prometheus access for a non-super user
Perform the following steps to configure read-only Prometheus access for a non-super user.
-
Add a new user to the NetScaler appliance.
add system user <ns_user_name> <ns_user's_password> -externalAuth enabled -promptString user-%u-at-%T logging enabled
<!--NeedCopy-->
Example :
add system user nspaul nspaul -externalAuth enabled -promptString user-%u-at-%T logging enabled <!--NeedCopy--> -
Create a command policy for a read-only user. This command policy allows read-only access from any file under the
/var/nslog/ directory.add system cmdPolicy read-only-prometheus ALLOW "(^man.*)|(^show\\s+(?!system)(?!configstatus)(?!ns ns\\.conf)(?!ns savedconfig)(?!ns runningConfig)(?!gslb runningConfig)(?!audit messages)(?!techsupport).*)|(^stat.*)|(show system file .* -filelocation \"/var/nslog\")" <!--NeedCopy--> -
If metrics are only written to a certain file, you may even limit user access such that they can only get that specific file.
add system cmdPolicy read-only-prometheus ALLOW "(^man.*)|(^show\\s+(!system)(!configstatus)(!ns ns\\.conf)(!ns savedconfig) (!ns runningConfig)(!gslb   runningConfig)(!audit messages)(!techsupport).*)|(^stat.*) |(show system file metrics_prom_<name_of_timeseries_profile>.log -filelocation \"/var/nslog\")"
<!--NeedCopy-->
Note:
In the
show system filecommand, specify the name of the time series profile you have configured in place ofname_of_ timeseries_profile. -
Bind a user with the command policy.
bind system user <userName> ((<policyName> <priority>) | -partitionName <string>)
<!--NeedCopy-->
For example :
bind system user user1 read-only-prometheus 0
<!--NeedCopy-->
To unbind and remove a user from the command policy use the following commands:
-
Unbind a configured user from the system command policy.
unbind system user <userName> (<policyName> | -partitionName <string>
<!--NeedCopy-->
For example:
unbind system user user1 read-only-prometheus <!--NeedCopy--> -
Remove the command policy from NetScaler.
rm system cmdPolicy read-only-prometheus
<!--NeedCopy-->
Add Prometheus as a data source in Grafana
If you need visualization of metrics using Grafana dashboards, you need to add Prometheus as a data source in Grafana. For more information, see add Prometheus as a data source in Grafana.
Create the visualization of metrics in Grafana
You can create a Grafana dashboard and select the key metrics and the appropriate visualization-type.
The following procedure shows adding a metric to the Grafana panel and creating a sample visualization dashboard.
- Specify the Panel Title.
- In the Query tab, for the query A, specify the required metric.
- In the Settings tab, select the Visualization type.
You can modify the data and its representation in Grafana. For more information, see the Grafana Documentation.
Following is a sample Grafana dashboard with a few NetScaler metrics:
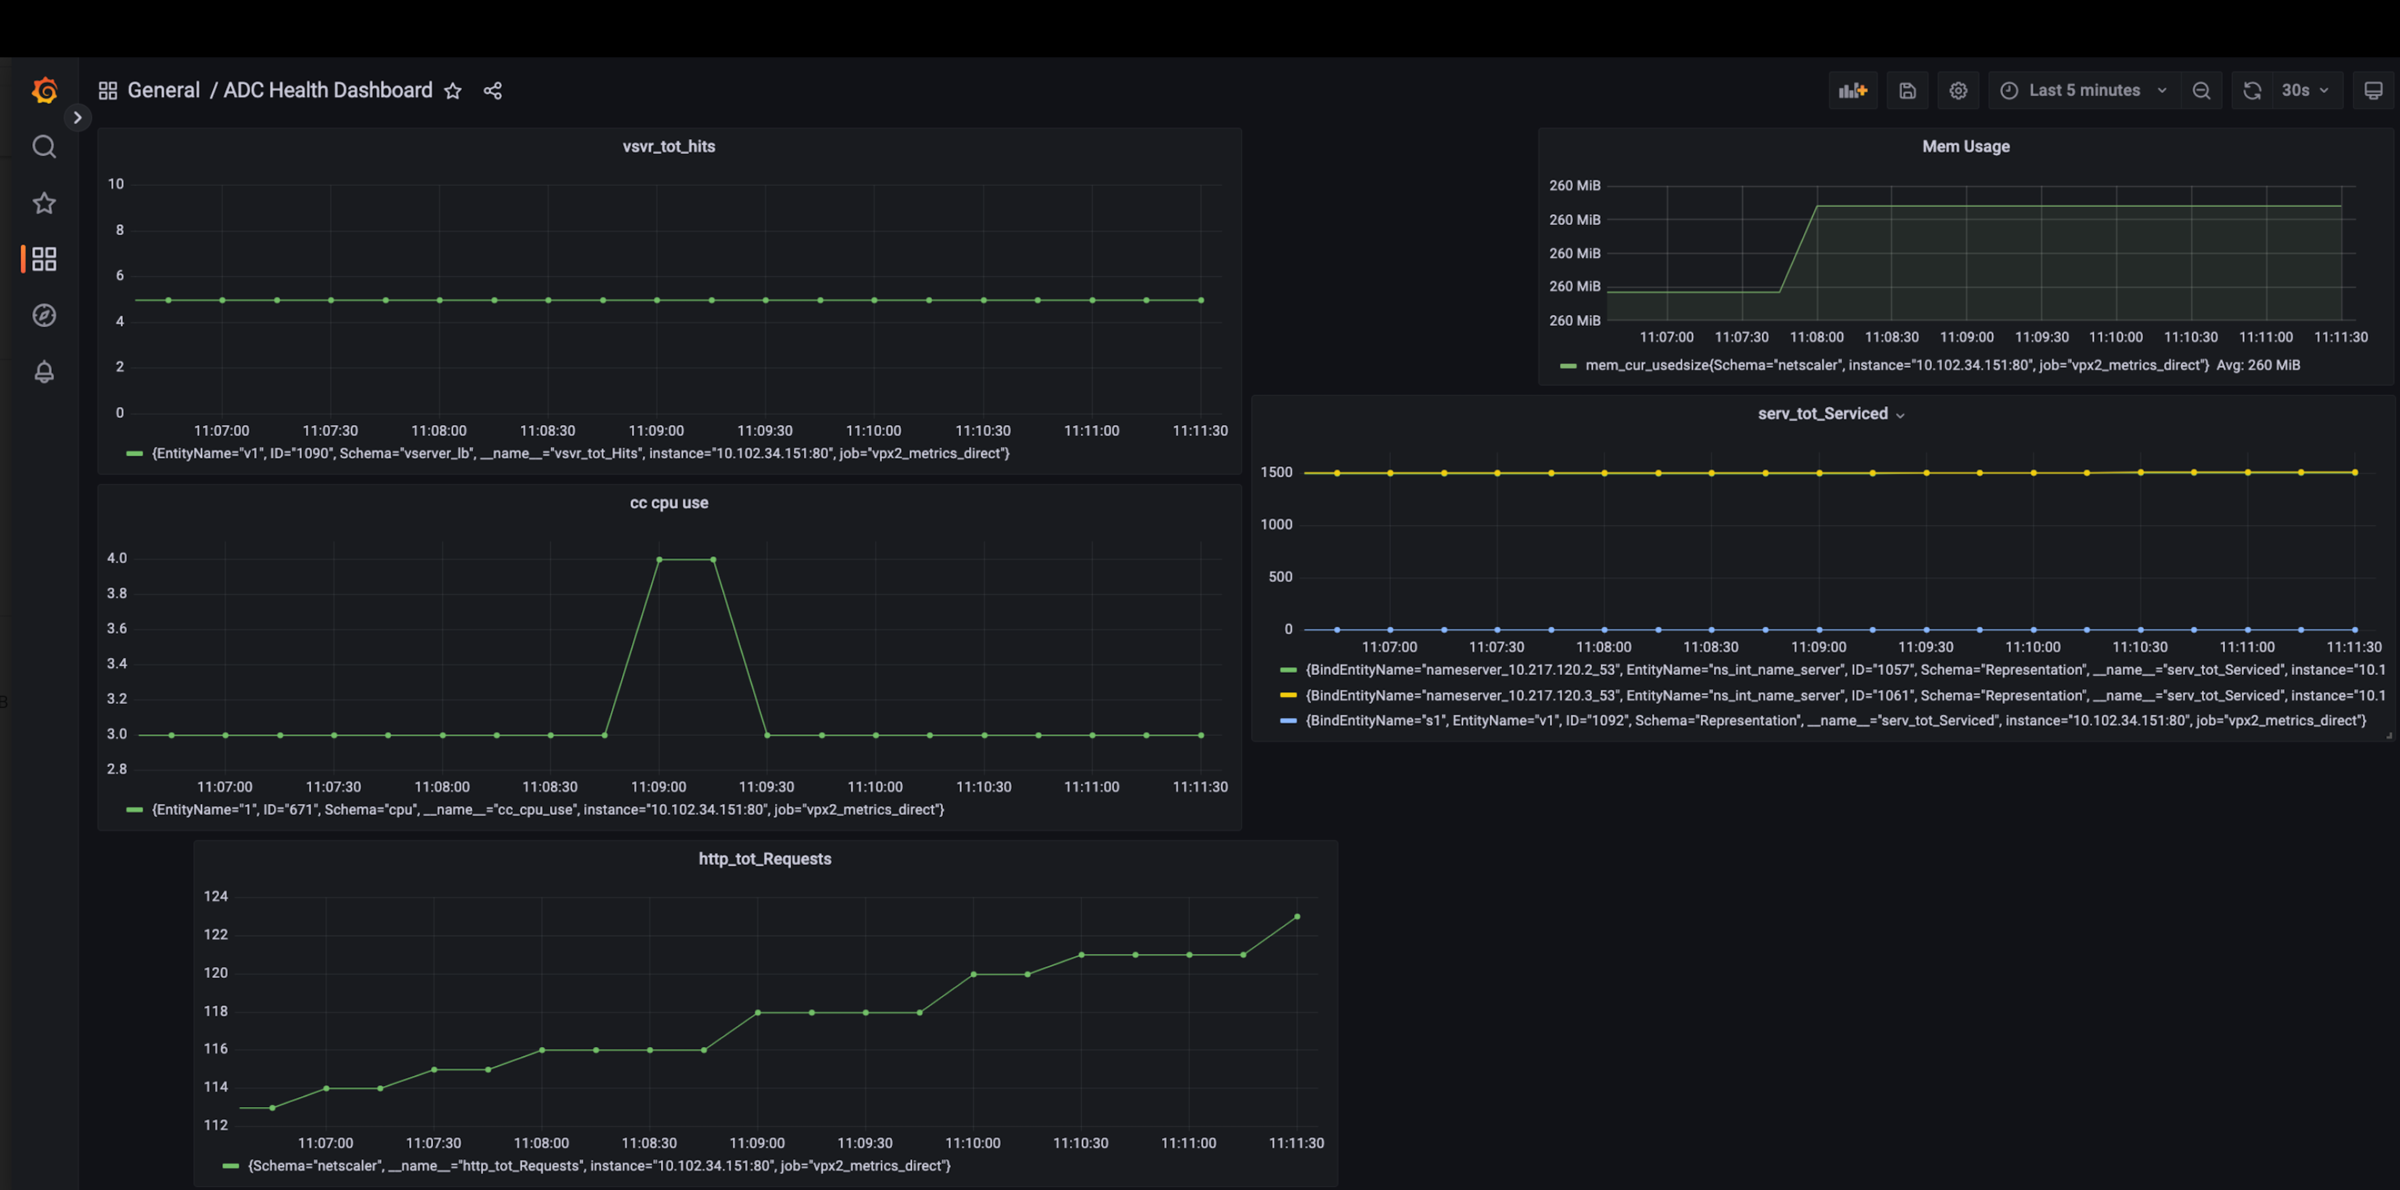
In this dashboard, you can see graphs for different NetScaler metrics such as:
-
vsvr_tot_Hits: Shows the number of requests received by the virtual server. -
cc_cpu_use: Shows the CPU utilization percentage. -
http_tot_Requests: Shows HTTP requests received. -
serv_tot_serviced: Shows the request being serviced. -
mem_cur_used_size: Shows the currently used memory of the NetScaler appliance.
Troubleshoot issues related to export of metrics to Prometheus
For information on troubleshooting issues related to export of metrics, see Troubleshoot issues related to export of metrics.
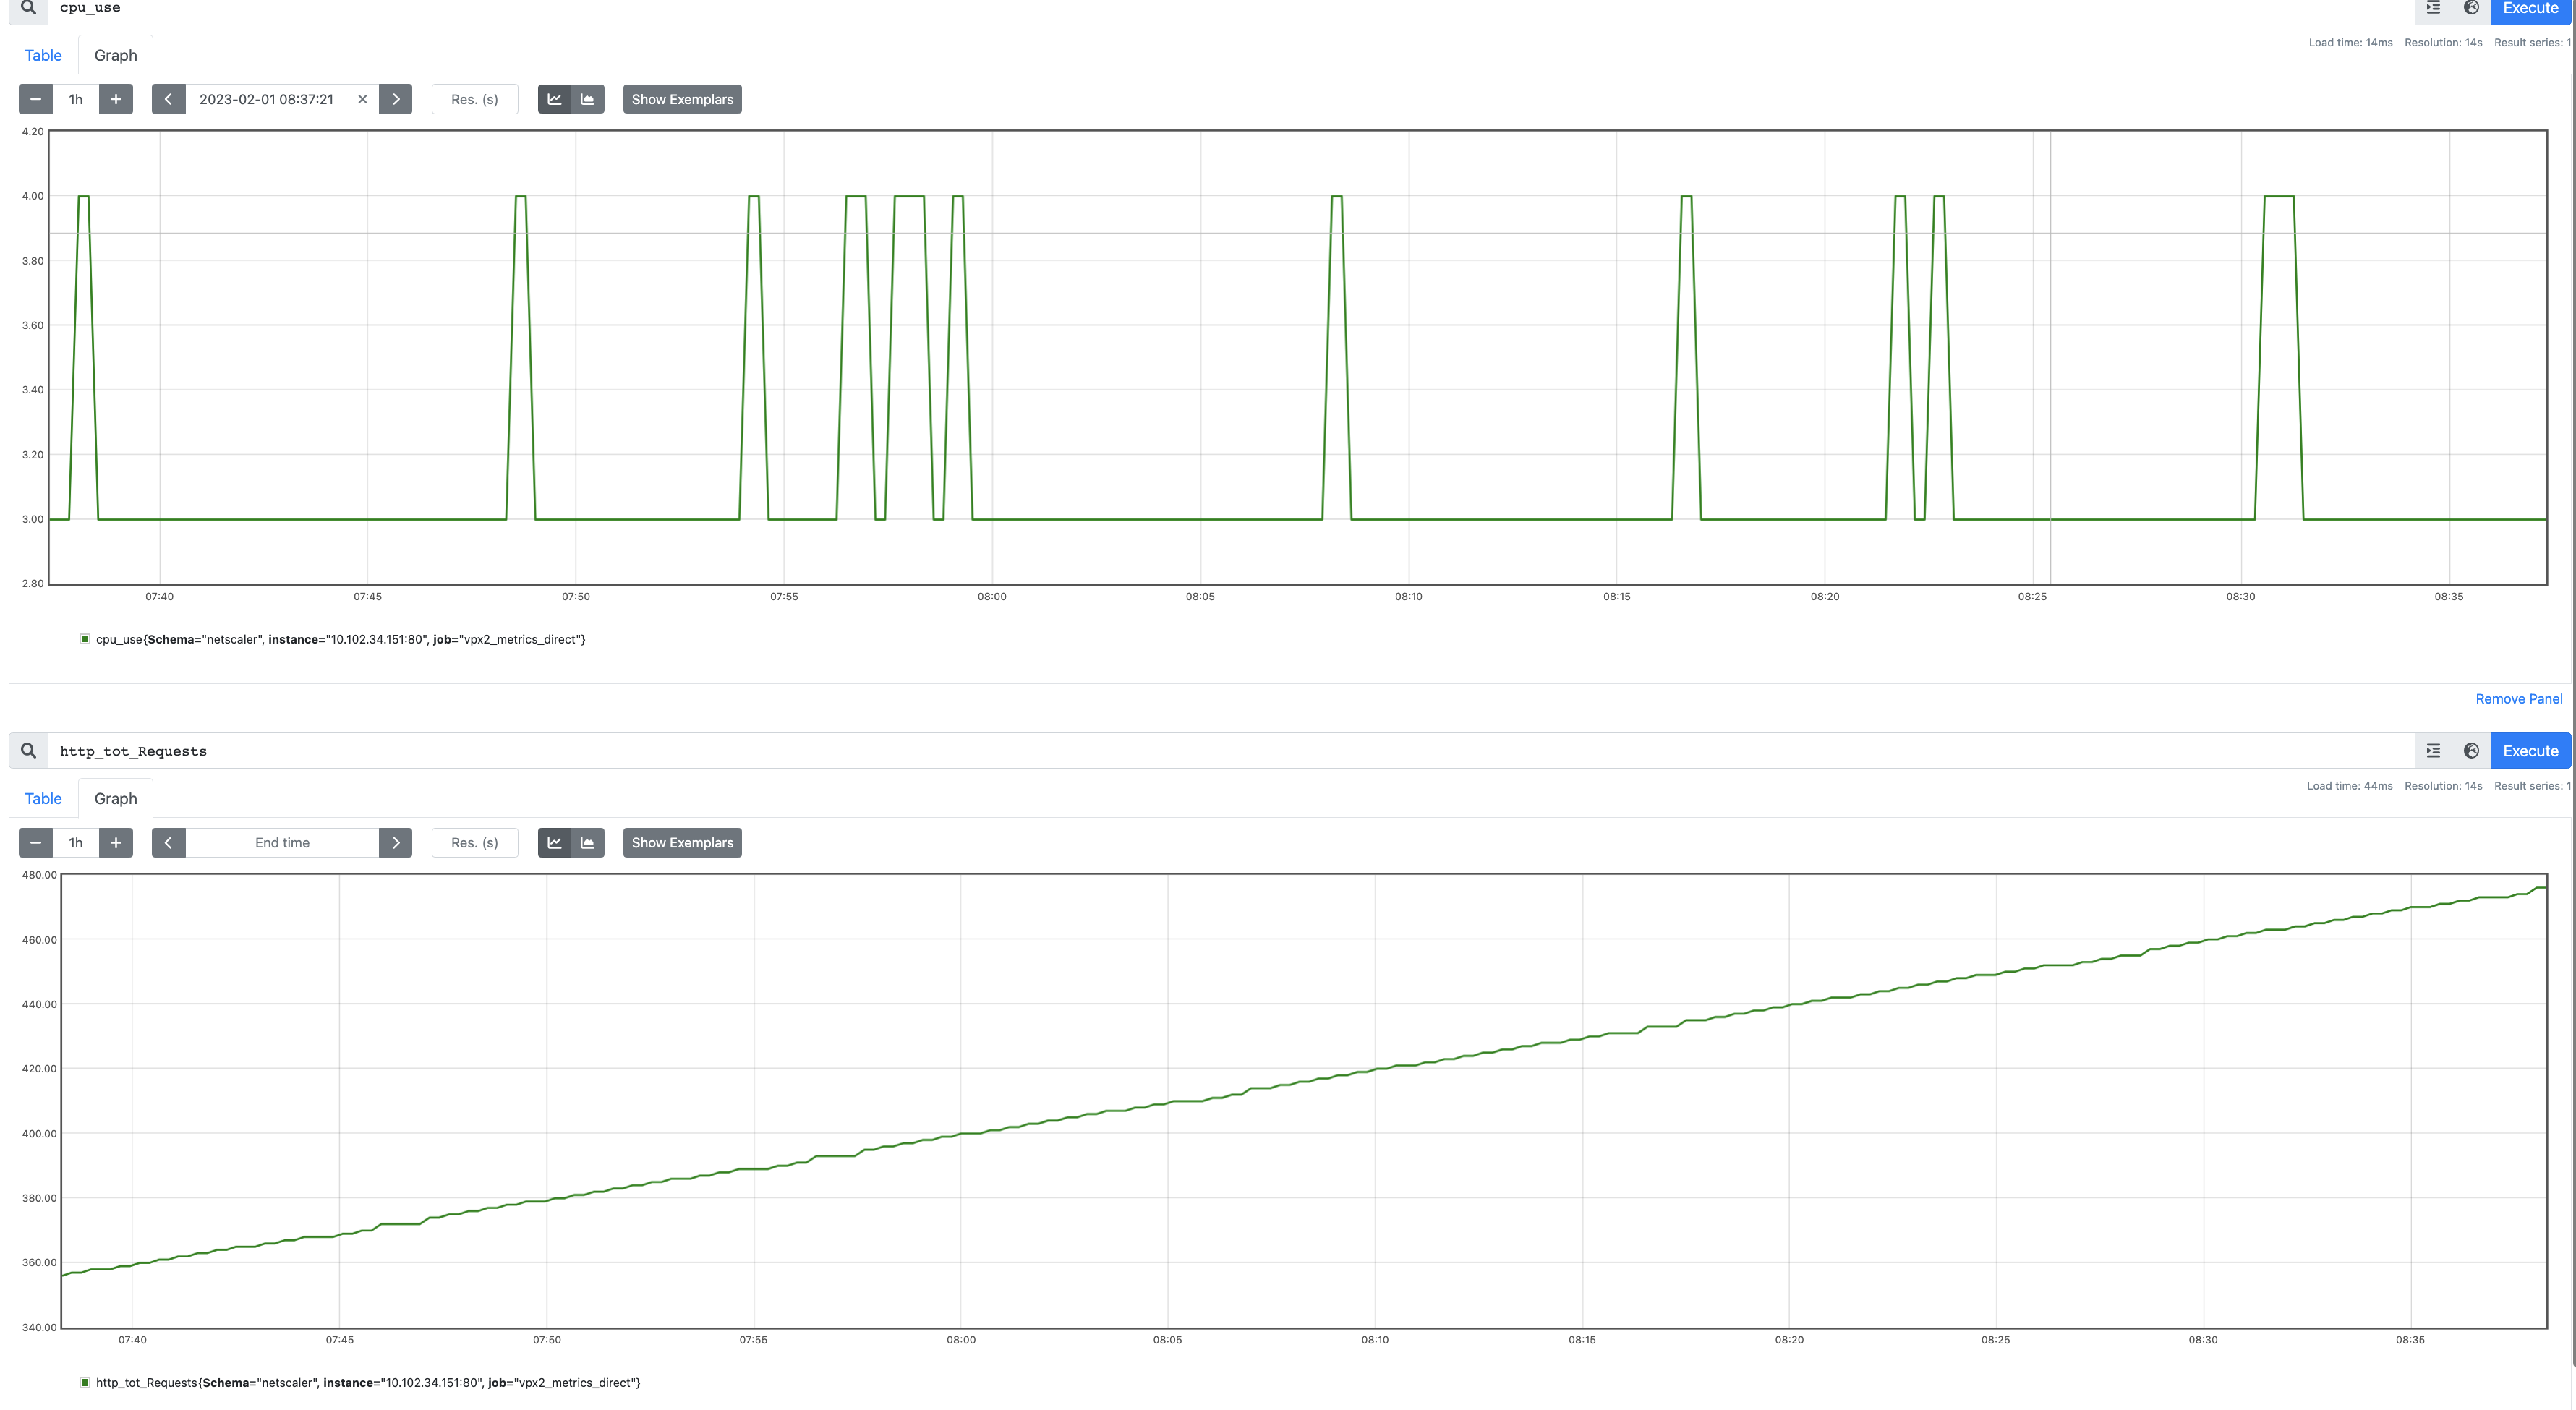
Sample Prometheus graphs
Using the Prometheus expression browser, you can display the time series metrics collected by the Prometheus server. You can access the expression browser by pointing to prometheu-server-ip-address/graph in your browser. You can enter an expression and see the result either as a table or graph over time. Specify which exact metric that you want to display by typing in the metric name into the Expression field. You can specify multiple counters using different panels.
The following diagram shows Prometheus graphs for two NetScaler metrics cpu_use and http_tot_requests.
Sample Grafana dashboard
NetScaler supports sample dashboards on Grafana. For complete list of sample dashboards supported on Grafana and their details, see Sample dashboards for Grafana.
You can download the sample dashboards from NetScaler downloads page.
Additional information
Schema with the required NetScaler counters to export
Metrics collector exports counters present in the configured schema file. The /var/metrics_conf/schema.json file is the default schema file configured in the analytics profile.
The schema file is a list of entity types and associated counters. In the schema, all global or system level counters are grouped under the entity type netscaler. Some of the global counters are CPU usage (cpu_use), management CPU usage (mgmt_cpu_use), and total number of HTTP requests received (http_tot_Requests). The counters specific to service groups, lbvserver, csvserver, and so on are listed under the respective entity types.
Following is a sample of counters in the schema.json file for the authentication virtual server (vserver_authn) entity.
"vserver_authn":
  [
      {"name":"si_tot_Requests","rate":"True"},
      {"name":"si_tot_Responses","rate":"True"},
      {"name":"si_tot_RequestBytes","rate":"True"},
      {"name":"si_cur_state","rate":"False"},
      {"name":"si_tot_ResponseBytes","rate":"True"},
      {"name":"si_peer_port","rate":"True"},
      {"name":"vsvr_Protocol","rate":"False"}
  ]
<!--NeedCopy-->
The following table explains the counters mentioned in this sample:
| Counter name | Description |
|---|---|
si_tot_Requests |
Total number of requests received on this service or virtual server. |
si_tot_Responses |
Total number of responses received on this service or virtual server. |
si_tot_RequestBytes |
Total number of request bytes received on this service or virtual server. |
si_cur_state |
Current state of the virtual server. |
si_tot_ResponseBytes |
Total number of response bytes received on this service or virtual server. |
si_peer_port |
The port on which the service is running. |
vsvr_Protocol |
Protocol associated with the virtual server. |
The rate field can be set as True if the rate value a counter needs to be exported. For example, the rate of si_tot_Requests is exported if the rate is set to True for si_tot_Requests.
Following is a sample of counters from the netscaler entity.
"netscaler":
  [
      {"name":"cpu_use","rate":"False"},
      {"name":"mgmt_cpu_use","rate":"False"},
      {"name":"tcp_tot_rxpkts","rate":"True"},
      {"name":"tcp_tot_rxbytes","rate":"True"},
      {"name":"tcp_tot_txpkts","rate":"True"},
      {"name":"tcp_tot_txbytes","rate":"True"},
      {"name":"tcp_cur_ClientConnEst","rate":"False"},
      {"name":"tcp_cur_ServerConnEst","rate":"False"},
      {"name":"tcp_cur_ClientConn","rate":"False"},
      {"name":"tcp_cur_ClientConnClosing","rate":"False"},
      {"name":"tcp_tot_ClientOpen","rate":"True"},
      {"name":"tcp_cur_ServerConn","rate":"False"},
      {"name":"tcp_cur_ServerConnClosing","rate":"False"},
      {"name":"http_tot_Requests","rate":"True"},
      {"name":"http_tot_Responses","rate":"True"},
      {"name":"http_tot_Gets","rate":"True"},
      {"name":"http_tot_Posts","rate":"True"},
      {"name":"http_tot_Others","rate":"True"},
  ]
<!--NeedCopy-->
The following table explains the counters mentioned in this sample:
| Counter name | Description |
|---|---|
cpu_use |
Tracks the CPU utilization percentage (CPU utilization percentage * 10). |
tcp_tot_rxpkts |
TCP packets received. |
tcp_tot_rxbytes |
Bytes of TCP data received. |
tcp_tot_txpkts |
TCP packets transmitted. |
tcp_tot_txbytes |
Bytes of TCP data transmitted. |
tcp_cur_ClientConnEst |
Current client connections in the Established state, which indicates that data transfer can occur between the NetScaler appliance and the client. |
tcp_cur_ServerConnEst |
Current server connections in the Established state, which indicates that data transfer can occur between the NetScaler appliance and the server. |
tcp_cur_ClientConn |
Client connections, including connections in the Opening, Established, and Closing state. Server connections, including connections in the Opening, Established, and Closing state. |
tcp_cur_ClientConnClosing |
Client connections in the Closing state, which indicates that the connection termination process has initiated but is not complete. |
tcp_cur_ServerConn |
Server connections, including connections in the Opening, Established, and Closing state. |
tcp_cur_ServerConnClosing |
Server connections in the Closing state, which indicates that the connection termination process has initiated but is not complete. |
http_tot_Requests |
This counter tracks HTTP requests received using the GET method. |
http_tot_Responses |
This counter tracks HTTP requests received using the POST method. |
http_tot_Gets |
This counter tracks HTTP requests received using the GET method. |
http_tot_Posts |
This counter tracks HTTP requests received. |
http_tot_Others |
This counter tracks HTTP requests received using methods other than GET and POST. |
Following is a sample of counters from the vserver_ssl entity.
"vserver_ssl":
  [
    {"name":"ssl_ctx_tot_session_hits","rate":"True"},
    {"name":"ssl_ctx_tot_session_new","rate":"True"},
    {"name":"ssl_ctx_tot_enc_bytes","rate":"True"},
    {"name":"ssl_ctx_tot_dec_bytes","rate":"True"},
  ]
<!--NeedCopy-->
The following table explains the SSL counters mentioned in this sample:
| Counter name | Description |
|---|---|
ssl_ctx_tot_session_hits |
This counter tracks the number of session hits. |
ssl_ctx_tot_session_new |
This counter tracks the number of new sessions created. |
ssl_ctx_tot_enc_bytes |
This counter tracks the number of encrypted bytes per SSL virtual server. |
ssl_ctx_tot_dec_bytes |
This counter tracks the number of bytes decrypted per SSL virtual server. |
Subscription of counters for multiple time series profiles
NetScaler supports creating multiple time series profiles and specifies different set of counters for each profile. Also, you can export only the counters based on your requirements.
You must create multiple schema.json files containing the necessary counters with unique names and the .json extension to configure multiple time series profiles. A reference schema file reference_schema.json is available under the path /var/metrics_conf/ for your reference.
The configuration of the two new time series profiles is as follows:
  add analytics profile ns_analytics_timeseries_profile_1   -type timeseries -schemaFile schema1.json

  set analytics profile  ns_analytics_timeseries_profile_1 -outputMode prometheus -serveMode PULL -metrics ENABLED

  add analytics profile ns_analytics_timeseries_profile_2   -type timeseries -schemaFile schema2.json

  set analytics profile  ns_analytics_timeseries_profile_2 -outputMode prometheus -serveMode PULL -metrics ENABLED
  <!--NeedCopy-->
In this example, schema1.json and schema2.json have different sets of counters.
Prometheus configuration
Configuration of a sample prometheus.yml file is as follows:
scrape_configs:
  - job_name: 'vpx2_metrics_direct'
    metrics_path: /metrics
    params:
     - 'profile_name'
    basic_auth:
     username: 'prom_user'
     password: 'user_password'
    scheme: https
    scrape_interval: 30s
    follow_redirects: true
    static_configs:
     - targets: ['ADC1-ip:port', 'ADC2-ip:port']
<!--NeedCopy-->
Access metrics on NetScaler CPX™ without basic authentication
Prometheus extracts metrics from NetScaler using the /metrics URL with basic authentication across all NetScaler form factors. However, as per Prometheus standards, /metrics must function without authentication. From NetScaler release 14.1-43.x onwards, NetScaler CPX supports extracting metrics without basic authentication. For extracting metrics from NetScaler CPX without basic authentication, you must set Env NS_CPX_METRICS_NO_AUTH to 1.
Example:
scrape_configs:
  - job_name: 'vpx2_metrics_direct'
    metrics_path: /metrics
    params:
     - 'profile_name'
    basic_auth:
     username: 'prom_user'
     password: 'user_password'
    scheme: https
    scrape_interval: 30s
    follow_redirects: true
    static_configs:
     - targets: ['ADC1-ip:port', 'ADC2-ip:port']
<!--NeedCopy-->
In the preceding sample Prometheus configuration, the requests use the following mapping to fetch the metrics in Prometheus format present under /var/nslog.
-
/metricsmaps to/var/nslog/metrics_prom_ns_analytics_time_series_profile.logfile -
/metrics?profilename=<name of the analytics profile>maps to/var/nslog/metrics_prom_<name of the analytics profile>.logfile
Share
Share
In this article
- Export of metrics from NetScaler to Prometheus
-
Configure the export of metrics from NetScaler to Prometheus and visualization using Grafana
- Configure a time series analytics profile on NetScaler to support the Prometheus pull mode
- Install and configure Prometheus for metrics export from NetScaler
- Configure read-only Prometheus access for a non-super user
- Add Prometheus as a data source in Grafana
- Create the visualization of metrics in Grafana
- Troubleshoot issues related to export of metrics to Prometheus
- Sample Prometheus graphs
- Sample Grafana dashboard
- Additional information
This Preview product documentation is Cloud Software Group Confidential.
You agree to hold this documentation confidential pursuant to the terms of your Cloud Software Group Beta/Tech Preview Agreement.
The development, release and timing of any features or functionality described in the Preview documentation remains at our sole discretion and are subject to change without notice or consultation.
The documentation is for informational purposes only and is not a commitment, promise or legal obligation to deliver any material, code or functionality and should not be relied upon in making Cloud Software Group product purchase decisions.
If you do not agree, select I DO NOT AGREE to exit.