-
Getting Started with NetScaler
-
Solutions for Telecom Service Providers
-
Load Balance Control-Plane Traffic that is based on Diameter, SIP, and SMPP Protocols
-
Provide Subscriber Load Distribution Using GSLB Across Core-Networks of a Telecom Service Provider
-
Authentication, authorization, and auditing application traffic
-
Basic components of authentication, authorization, and auditing configuration
-
-
Web proxy support for outbound calls to IDP or third party endpoints
-
Web Application Firewall protection for VPN virtual servers and authentication virtual servers
-
On-premises NetScaler Gateway as an identity provider to Citrix Cloud™
-
Authentication, authorization, and auditing configuration for commonly used protocols
-
Troubleshoot authentication and authorization related issues
-
-
-
-
-
-
-
Configure DNS resource records
-
Configure NetScaler as a non-validating security aware stub-resolver
-
Jumbo frames support for DNS to handle responses of large sizes
-
Caching of EDNS0 client subnet data when the NetScaler appliance is in proxy mode
-
Use case - configure the automatic DNSSEC key management feature
-
Use Case - configure the automatic DNSSEC key management on GSLB deployment
-
-
-
Source IP address whitelisting for GSLB communication channels
-
Use case: Deployment of domain name based autoscale service group
-
Use case: Deployment of IP address based autoscale service group
-
-
Persistence and persistent connections
-
Advanced load balancing settings
-
Gradually stepping up the load on a new service with virtual server–level slow start
-
Protect applications on protected servers against traffic surges
-
Retrieve location details from user IP address using geolocation database
-
Use source IP address of the client when connecting to the server
-
Use client source IP address for backend communication in a v4-v6 load balancing configuration
-
Set a limit on number of requests per connection to the server
-
Configure automatic state transition based on percentage health of bound services
-
-
Use case 2: Configure rule based persistence based on a name-value pair in a TCP byte stream
-
Use case 3: Configure load balancing in direct server return mode
-
Use case 6: Configure load balancing in DSR mode for IPv6 networks by using the TOS field
-
Use case 7: Configure load balancing in DSR mode by using IP Over IP
-
Use case 10: Load balancing of intrusion detection system servers
-
Use case 11: Isolating network traffic using listen policies
-
Use case 12: Configure Citrix Virtual Desktops for load balancing
-
Use case 13: Configure Citrix Virtual Apps and Desktops for load balancing
-
Use case 14: ShareFile wizard for load balancing Citrix ShareFile
-
Use case 15: Configure layer 4 load balancing on the NetScaler appliance
-
-
Logs
-
-
-
Authentication and authorization for System Users
-
-
-
Configuring a CloudBridge Connector Tunnel between two Datacenters
-
Configuring CloudBridge Connector between Datacenter and AWS Cloud
-
Configuring a CloudBridge Connector Tunnel Between a Datacenter and Azure Cloud
-
Configuring CloudBridge Connector Tunnel between Datacenter and SoftLayer Enterprise Cloud
-
Configuring a CloudBridge Connector Tunnel Between a NetScaler Appliance and Cisco IOS Device
-
CloudBridge Connector Tunnel Diagnostics and Troubleshooting
This content has been machine translated dynamically.
Dieser Inhalt ist eine maschinelle Übersetzung, die dynamisch erstellt wurde. (Haftungsausschluss)
Cet article a été traduit automatiquement de manière dynamique. (Clause de non responsabilité)
Este artículo lo ha traducido una máquina de forma dinámica. (Aviso legal)
此内容已经过机器动态翻译。 放弃
このコンテンツは動的に機械翻訳されています。免責事項
이 콘텐츠는 동적으로 기계 번역되었습니다. 책임 부인
Este texto foi traduzido automaticamente. (Aviso legal)
Questo contenuto è stato tradotto dinamicamente con traduzione automatica.(Esclusione di responsabilità))
This article has been machine translated.
Dieser Artikel wurde maschinell übersetzt. (Haftungsausschluss)
Ce article a été traduit automatiquement. (Clause de non responsabilité)
Este artículo ha sido traducido automáticamente. (Aviso legal)
この記事は機械翻訳されています.免責事項
이 기사는 기계 번역되었습니다.책임 부인
Este artigo foi traduzido automaticamente.(Aviso legal)
这篇文章已经过机器翻译.放弃
Questo articolo è stato tradotto automaticamente.(Esclusione di responsabilità))
Translation failed!
Logs
Logs refer to the software-generated data that contains information about usage patterns, activities and operations within an operating system, application, server, or another device. The files that store these logs are called the log files. Log files are the primary data source for network observability.
This topic covers the following:
Audit logs
Auditing is a methodical examination or review of a condition or situation. The audit logging feature enables you to log the NetScaler states and status information collected by various modules. The log information can be in the kernel and in the user-level daemons.
You can configure NetScaler to store the log information locally on NetScaler or export it to a remote server or both. For more information on audit logs, see Audit logging.
Configure audit logs
For information on how to configure NetScaler for audit logging, see Configuring NetScaler appliance for audit logging.
Sample audit log
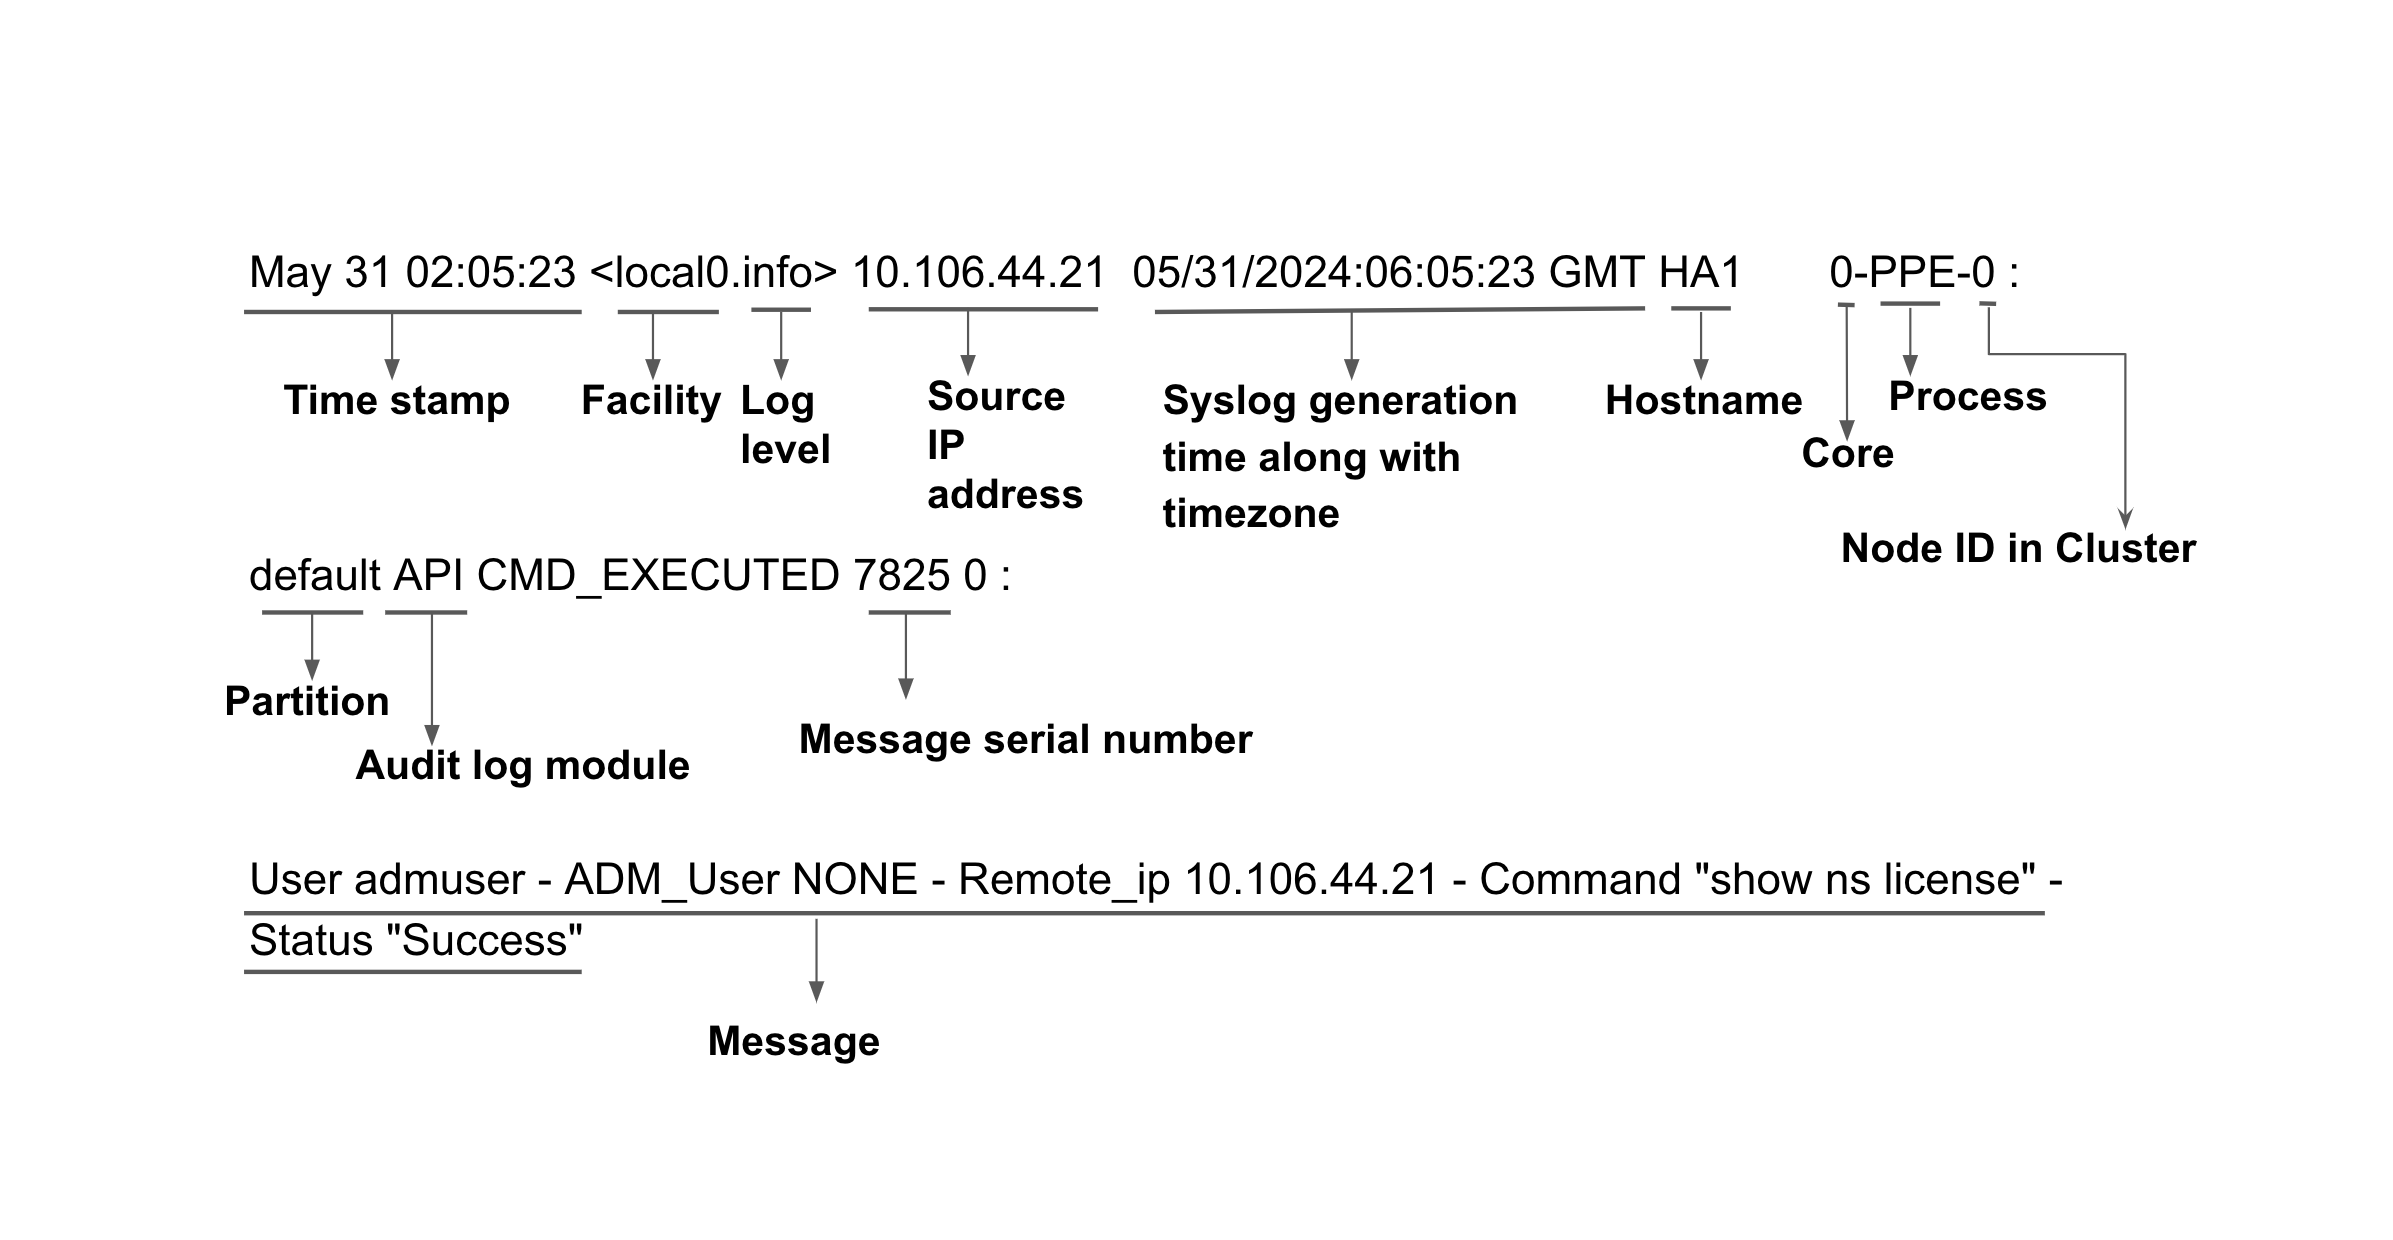
The following is a sample audit log:
May 31 02:05:23 <local0.info> 10.106.44.21  05/31/2024:06:05:23 GMT HA1 0-PPE-0 : default API CMD_EXECUTED 7825 0 :  User admuser -
ADM_User NONE - Remote_ip 10.106.44.21 - Command "show ns license" - Status "Success"
<!--NeedCopy-->
The following image describes the audit log:
Export audit logs
You can export audit logs and events from NetScaler to industry standard log aggregator platforms such as Splunk and get meaningful insights. For more information, see Export audit logs and events directly from NetScaler to Splunk.
You can export audit logs securely over an SSL connection. For more information, see Export syslog securely over SSL.
Management logs
Management logs are the logs that are generated by the processes that are running on the NetScaler management core. (For example, bash, httpd). The messages that are part of the following log files are exported as part of management logs:
-
Shell or platform logs
-
bash.log: The log file is created by thebashprocess. It records the commands processed by thebashshell. -
sh.log: The log file is created by theshprocess. It records the commands processed by theshshell.
-
Access logs
-
auth.log: The log file records allSSHdactivity andConsoleactivity. -
nsvpn.log: The log file records detailed information about Virtual Private Network (VPN) activities and events.
-
httpaccess.log: The log file records any HTTP activity directed to the management IP address is logged. Typically, this log file includes NetScaler GUI access, NITRO API and VPN access. -
httperror.log: The log file records any HTTP activity directed to the management IP address and resulting in an error due to any timeout (example, PHP maximum timeout reached) or any programming error in the backend. Periodic Apache restarts also get logged into this file. -
httpaccess-vpn.log: The log file consists of gateway portal endpoints data served by apache that are accessed by users along with the date and time. -
httperror-vpn.log: The log file consists of gateway portal endpoints data served by apache that are accessed by users along with the date and time.
NetScaler® management logs
-
notice.log: The log file is a syslog data stream and it records the syslog records that are generated according to the “notice” datastream ofsyslogd. -
ns.log: The log file contains the NetScaler system log. The logs generated by several modules of NetScaler (for example, load balancing, SSL, app firewall) are written into this file. During export, only the content ofns.logwhich is written by the management processes are exported. The logs written by the NSPPE processes are not exported.
Management logs are logged to respective log files by the syslogd running on NetScaler which are generated by various processes running on management core. Management logs are exported periodically, typically every 60 seconds.
Configure export of management logs
You can configure the export of management logs using one of the following methods:
- Configure export of management logs to a syslog server
- Configure export of management logs to an HTTP server or HEC endpoint such as Splunk
Note:
When configuring syslog action and analytics profiles, it is recommended not to use
NSMGMTfor management log. UsingNSMGMTmight negatively impact the performance of NetScaler.For example, in
add audit syslogAction test1 <IP address> -serverPort <port> -logLevel ALL -managementlog <ACCESS | ALL | NONE | NSMGMT | SHELL>andadd analytics profile <profile-name> -type timeseries -managementlog <ACCESS | ALL | NONE | NSMGMT | SHELL>commands, avoid usingNSMGMTfor-managementlog.
Configure export of management logs to Syslog server
To configure the export of management logs, you must perform the following steps:
- Create an audit syslog action on NetScaler with the management log option.
- Create a syslog audit policy with the syslog action.
- Bind the syslog audit policy with the system global entity to enable logging of all NetScaler system events.
Note:
- Management logs are not supported in non-default admin partitions.
- If the transport is TCP, then management logs are not exported out of secondary nodes by default. Load balancing configuration can be used to enable secondary export for syslog when the destination is reachable using NSIP address and secondary export is required.
- Starting with NetScaler release 14.1-29.x, the management logs exported by NetScaler comply with RFC 5424.
Configure syslog audit action
To configure syslog audit action on NetScaler using CLI, run the following command:
add audit syslogAction <name> \(<serverIP> \[-serverPort <port>] -logLevel <logLevel> ... \[-managementlog <managementlog> ...] ... \[-mgmtloglevel <managementloglevel> ...]\[-transport \( TCP | UDP )])
<!--NeedCopy-->
Example:
add audit syslogAction test 10.106.186.102 -serverPort 514 -logLevel ALL -managementlog SHELL NSMGMT -mgmtloglevel ALL -transport TCP
<!--NeedCopy-->
In this configuration:
-
name: Name of the syslog action -
serverIP: IP address of the syslog server. -
serverPort: Port on which the syslog server accepts connections. -
logLevel: Audit log level. -
managementlog: Types of management logs that you must export. -
mgmtloglevel: Management log levels that you want to set for export. -
transport: The transport type used to send audit logs to the syslog server.
To configure syslog audit action on NetScaler using the GUI, perform the following steps:
- Navigate to the System > Auditing > Syslog > Server tab and click Add.
- On the Create Auditing Server page, provide the following details:
- Enter a name for the Syslog server.
- Select Server IP from the Server Type list and enter the syslog server IP address and port.
- Choose the required log levels from the Log Levels, Management Logs and Management Log Levels sections.
- Click Create.
Load balance management logs
In releases prior to NetScaler 14.1-29.x, when management logs are enabled, the syslogAction configuration supports only server IP address and port configuration. Domain Based Service (DBS) and load balancing virtual server name configurations are not supported. For load balancing management logs, use the following sample configuration:
add service syslog_server <server_ip> UDP <port>
add service syslog_server1 1.3.4.4 UDP 514
add service syslog_server2 1.3.4.5 UDP 514
add lb vserver lb1 UDP <lb_vip> <lb_port>
bind lb vserver lb1 syslog_server1
bind lb vserver lb1 syslog_server2
<!--NeedCopy-->
In syslogAction, configure the following:
add syslogAction sys1 <server_ip> -serverPort <server_port> -transport UDP -loglevel <loglevel>
add syslogAction sys1 lb_vip -serverPort lb_port -transport UDP -loglevel <loglevel>
<!--NeedCopy-->
In releases NetScaler 14.1-29.x and later, when management logs are enabled, the syslogAction configuration supports load balancing virtual server name. For load balancing management logs, use the following sample configuration:
add service syslog_server1 10.9.8.7 UDP 514
add service syslog_server2 10.9.8.8 UDP 514
add lb vserver syslog_lb SYSLOGUDP
bind lb vserver syslog_lb syslog_server1
bind lb vserver syslog_lb syslog_server2
<!--NeedCopy-->
Configure syslog to use the above virtual server, and enable management logs on the action.
add syslogAction syslog_act -lbVserverName syslog_lb -logLevel NONE -managementLog ALL -mgmtlogLevel ALL
add syslogPolicy syslog_pol true syslog_act
bind syslogGlobal -policyName syslog_pol -priority 1
<!--NeedCopy-->
You can also configure domain name on syslog action, instead of IP address. The following is a sample configuration:
add syslogAction syslog_act my.syslog.server -logLevel NONE -managementLog ALL -mgmtlogLevel ALL
<!--NeedCopy-->
Configure syslog audit policy
To configure a syslog audit policy using the CLI, run the following command:
add audit syslogPolicy <name> TRUE <syslogAction>
Example:
add audit syslogPolicy test-policy TRUE test
To configure a syslog audit policy using the GUI, perform the following steps:
- Navigate to the System > Auditing > Syslog > Policies tab and click Add.
- On the Create Auditing Syslog Policy page, enter a name, select Advanced Policy, and then select the audit syslog server that you created from the Server list.
Bind audit log policy
To bind the syslog audit log policy to the bind point SYSTEM_GLOBAL using CLI, run the following command:
bind audit syslogGlobal <policyname> -globalBindType SYSTEM_GLOBAL
Example:
bind audit syslogGlobal test-policy -globalBindType SYSTEM_GLOBAL
To bind the syslog audit log policy globally using the GUI, run the following command:
- Navigate to the System > Auditing > Syslog > Policies tab and select the syslog audit policy that you created.
- Right-click on the selected syslog audit policy and click Advanced Policy Global Bindings.
- Select the syslog audit policy that you created from the Select Policy list.
- Enter the priority in the Priority field.
- Select SYSTEM_GLOBAL from the Global Bind Type field and click Bind.
- On the Syslog Auditing page, select the syslog audit policy and click Done.
Once the configuration is successful, the management logs are sent as syslog payloads to the external syslog server.
Configure export of management logs to Splunk configured as HTTP server
You can configure Splunk as an HTTP server. In the HTTP server configuration, you can use the HTTP event collector to send management logs over HTTP (or HTTPS) directly to the Splunk platform from your NetScaler. For more information, see Export management logs to Splunk configured as an HTTP server.
Sample management log
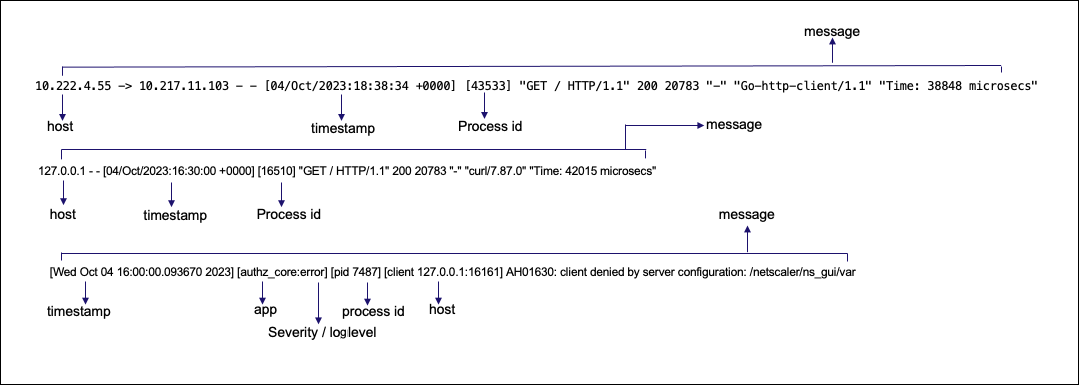
The following is a sample management log:
10.222.4.55 10.217.11.103 [04/Oct/2023:18:38:34 +0000] [43533] "GET / HTTP/1.1" 200 20783 "Go-http-client/l.1" "Time: 38848 microsecs"

127.0.0.1 [04/0ct/2023:16:30:00 +0000] [16510] "GET / HTTP/1.1" 200 20783 “curl/7.87.0" "Time: 42015 microsecs"

[Wed Oct 04 16:00:00.093670 2023] [authz_core:error] [pid 7487] [client 127.0.0.1:16161] AH01630: client denied by server configuration: /netscaler/ns_gui/var
<!--NeedCopy-->
The following image describes the management log:
The following is a sample bash log:
Apr 24 11:21:00 <local7.notice> ns bash[3893]: root on /dev/pts/0 shell_command="PATH=/netscaler:/bin:/sbin:/usr/bin:/usr/sbin:/usr/libexec:/usr/local/bin:/usr/local/sbin:."
Apr 24 11:21:00 <local7.notice> ns bash[3893]: root on /dev/pts/0 shell_command="EDITOR=/usr/bin/vi"
Apr 24 11:21:00 <local7.notice> ns bash[3893]: root on /dev/pts/0 shell_command="[ -f /var/python/bin/python ]"
Apr 24 11:21:00 <local7.notice> ns bash[3893]: root on /dev/pts/0 shell_command="export PATH=$PATH:/var/python/bin"
Apr 24 11:21:00 <local7.notice> ns bash[3893]: root on /dev/pts/0 shell_command="[ -f /var/golang/bin/go ]"
Apr 24 11:21:00 <local7.notice> ns bash[3893]: root on /dev/pts/0 return_code="1"
Apr 24 11:21:00 <local7.notice> ns bash[3893]: root on /dev/pts/0 shell_command=""
Apr 24 11:21:12 <local7.notice> ns bash[3893]: root on /dev/pts/0 shell_command="cat /var/log/bash.log"
<!--NeedCopy-->
The following is a sample httpaccess log:
10.102.201.155 -> 10.102.201.155 - - [10/Jun/2024:23:07:11 +0530] [1571] "GET /nitro/v1/config/route6?format=json&sessionid=[FILTERED] HTTP/1.1" 200 1162 "-" "-" "Time: 9797 microsecs"

10.102.201.155 -> 10.102.201.155 - - [10/Jun/2024:23:07:11 +0530] [1571] "GET /nitro/v1/config/nslicense?format=json&sessionid=[FILTERED] HTTP/1.1" 200 1118 "-" "-" "Time: 7774 microsecs"

10.102.201.155 -> 10.102.201.155 - - [10/Jun/2024:23:07:11 +0530] [1571] "GET /nitro/v1/config/appflowparam?format=json&sessionid=[FILTERED] HTTP/1.1" 200 1643 "-" "-" "Time: 8098 microsecs"

10.102.201.155 -> 10.102.201.155 - - [10/Jun/2024:23:07:12 +0530] [1571] "GET /nitro/v1/config/snmpmib?format=json&sessionid=[FILTERED] HTTP/1.1" 200 347 "-" "-" "Time: 8185 microsecs"

10.102.201.155 -> 10.102.201.155 - - [10/Jun/2024:23:11:16 +0530] [1570] "GET /nitro/v1/config/nslicense?format=json&sessionid=[FILTERED] HTTP/1.1" 200 1118 "-" "-" "Time: 23195 microsecs"

10.102.201.155 -> 10.102.201.155 - - [10/Jun/2024:23:11:17 +0530] [1570] "GET /nitro/v1/config/nslicenseserver?format=json&sessionid=[FILTERED] HTTP/1.1" 200 57 "-" "-" "Time: 8992 microsecs"
<!--NeedCopy-->
The following is a sample httperror log:
[Mon Jun 10 15:00:01.016898 2024] [mpm_prefork:notice] [pid 47106] AH00171: Graceful restart requested, doing restart

[Mon Jun 10 15:00:01.323746 2024] [mpm_prefork:notice] [pid 47106] AH00163: Apache/2.4.56 (Unix) mod_perl/2.0.10 Perl/v5.30.2 configured -- resuming normal operations

[Mon Jun 10 15:00:01.323756 2024] [core:notice] [pid 47106] AH00094: Command line: '/bin/httpd -f /etc/httpd.conf'

[Mon Jun 10 15:30:00.211099 2024] [authz_core:error] [pid 80696] [client 127.0.0.1:31128] AH01630: client denied by server configuration: /netscaler/ns_gui/var

[Mon Jun 10 15:38:06.205307 2024] [authz_core:error] [pid 80696] [client 127.0.0.2:24903] AH01630: client denied by server configuration: /netscaler/ns_gui/var
<!--NeedCopy-->
The following is a sample auth log:
Jun 13 12:03:33 <auth.info> ns login: login on pts/1 as root
Jun 13 12:03:33 <auth.info> ns sshd[17798]: Received disconnect from 10.102.201.155 port 33145:11: Normal Shutdown
Jun 13 12:03:33 <auth.info> ns sshd[17798]: Disconnected from user admuser 10.102.201.155 port 33145
Jun 13 12:03:33 <auth.info> ns sshd[17803]: rexec line 19: Deprecated option UsePrivilegeSeparation
Jun 13 12:03:34 <auth.info> ns sshd[17803]: Accepted keyboard-interactive/NS for admuser from 10.102.201.155 port 65127 ssh2
<!--NeedCopy-->
The following is a sample nsvpn.log:
Jun  6 09:18:16 <local1.info> ns [1289]: (0-15) extract_ldap_attribute: retrieved mail value mail@citrix.com for Complex1, length is 15
Jun  6 09:18:16 <local1.info> ns [1289]: (0-15) receive_ldap_user_search_event: extracted attribute, name: mail, value: mail@citrix.com
Jun  6 09:18:16 <local1.info> ns [1289]: (0-15) receive_ldap_user_search_event: built group string for Complex1 of:group5 group4 group3 g1
Jun  6 09:18:16 <local1.info> ns [1289]: (0-15) receive_ldap_user_search_event: User search succeeded, attempting user authentication(Bind) for <Complex1>
Jun  6 09:18:16 <local1.info> ns [1289]: (0-15) receive_ldap_user_bind_event: Got user bind event.
Jun  6 09:18:16 <local1.info> ns [1289]: (0-15) receive_ldap_user_bind_event: User authentication (Bind event) for user Complex1 succeeded
Jun  6 09:18:16 <local1.notice> ns [1289]: (0-15) send_accept: sending accept to kernel for : Complex1
Jun  6 09:18:16 <local1.info> ns [1289]: (0-15) aaad_alloc_serialize_keyValue_attrs:  2 custom attribute key_len 4  value_len 15
Jun  8 06:21:48 <local1.info> ns [1289]: (0-62) aaad_remove_user_login_failure_info:  sqlite3_step is SUCCESS
<!--NeedCopy-->
The following is a sample httperror-vpn log:
[Thu Jun 06 17:43:38.184137 2024] [core:error] [pid 63478] (63)File name too long: [client 127.0.0.2:42117] AH00036: access to /logon/L                                                                                                                                                       ogonPoint/aaaaaaaaaaaaaaaaaaaaaaaaaaaaaaaaaaaaaaaaaaaaaaaaaaaaaaaaaaaaaaaaaaaaaaaaaaaaaaaaaaaaaaaaaaaaaaaaaaaaaaaaaaaaaaaaaaaaaaaaaaaaa                                                                                                                                                       aaaaaaaaaaaaaaaaaaaaaaaaaaaaaaaaaaaaaaaaaaaaaaaaaaaaaaaaaaaaaaaaaaaaaaaaaaaaaaaaaaaaaaaaaaaaaaaaaaaaaaaaaaaaaaaaaaaaaaaaaaaaaaaaaaaaaaa                                                                                                                                                       aaaaaaaaaaaaaaaaaaaaaaaaaaaaaaaaaaaaaaaaaaaaaaaaaaaaaaaaaaaaaaaaaaaaaaaaaaaaaaaaaaaaaaaaaaaaaaaaaaaaaaaaaaaaaaaaaaaaaaaaaaaaaaaaaaaaaaa                                                                                                                                                       aaaaaaaaaaaaaaaaaaaaaaaaaaaaaaaaaaaaaaaaaaaaaaaaaaaaaaaaaaaaaaaaaaaaaaaaaaaaaaaaaaaaaaaaaaaaaaaaaaaaaaaaaaaaaaaaaaaaaaaaaaaaaaaaaaaaaaa                                                                                                                                                       aaaaaaaaaResources/List failed (filesystem path '/var/netscaler/logon/LogonPoint/aaaaaaaaaaaaaaaaaaaaaaaaaaaaaaaaaaaaaaaaaaaaaaaaaaaaaa                                                                                                                                                       aaaaaaaaaaaaaaaaaaaaaaaaaaaaaaaaaaaaaaaaaaaaaaaaaaaaaaaaaaaaaaaaaaaaaaaaaaaaaaaaaaaaaaaaaaaaaaaaaaaaaaaaaaaaaaaaaaaaaaaaaaaaaaaaaaaaaaa                                                                                                                                                       aaaaaaaaaaaaaaaaaaaaaaaaaaaaaaaaaaaaaaaaaaaaaaaaaaaaaaaaaaaaaaaaaaaaaaaaaaaaaaaaaaaaaaaaaaaaaaaaaaaaaaaaaaaaaaaaaaaaaaaaaaaaaaaaaaaaaaa                                                                                                                                                       aaaaaaaaaaaaaaaaaaaaaaaaaaaaaaaaaaaaaaaaaaaaaaaaaaaaaaaaaaaaaaaaaaaaaaaaaaaaaaaaaaaaaaaaaaaaaaaaaaaaaaaaaaaaaaaaaaaaaaaaaaaaaaaaaaaaaaa                                                                                                                                                       aaaaaaaaaaaaaaaaaaaaaaaaaaaaaaaaaaaaaaaaaaaaaaaaaaaaaaaaaaaaaaaaaaaaaaaaaaaaaaaaResources')
[Thu Jun 06 17:44:23.338278 2024] [core:info] [pid 63475] [client 127.0.0.2:65214] AH00128: File does not exist: /var/netscaler/logon/L                                                                                                                                                       ogoqqqqnPoint/Resources/List
[Thu Jun 06 17:44:41.245211 2024] [core:info] [pid 63476] [client 127.0.0.2:56821] AH00128: File does not exist: /var/netscaler/logon/L                                                                                                                                                       og@
[Tue Jun 11 10:10:55.360797 2024] [core:info] [pid 37517] [client 127.0.0.2:53996] AH00128: File does not exist: /netscaler/ns_gui/vpn/                                                                                                                                                       pluginCustomization.json
[Mon Jun 17 14:11:15.816726 2024] [core:info] [pid 63188] [client 127.0.0.2:27594] AH00128: File does not exist: /netscaler/ns_gui/vpn/                                                                                                                                                       pluginCustomization.json
<!--NeedCopy-->
The following is a sample httpaccess-vpn log:
127.0.0.2 - - [20/Jun/2024:08:37:47 +0000] [1508] "GET /logon/LogonPoint/custom/strings.en.js?_=1718869081399 HTTP/1.1" 304 -          "-" "Mozilla/5.0 (Windows NT 10.0; Win64; x64; rv:120.0) Gecko/20100101 Firefox/120.0" "Time: 529 microsecs"
127.0.0.2 - - [20/Jun/2024:08:37:47 +0000] [1508] "GET /logon/LogonPoint/plugins/ns-gateway/nsg-epa.js HTTP/1.1" 304 - "-" "Mo         zilla/5.0 (Windows NT 10.0; Win64; x64; rv:120.0) Gecko/20100101 Firefox/120.0" "Time: 303 microsecs"
127.0.0.2 - - [20/Jun/2024:08:37:47 +0000] [1508] "GET /logon/LogonPoint/plugins/ns-gateway/nsg-setclient.js HTTP/1.1" 304 - "         -" "Mozilla/5.0 (Windows NT 10.0; Win64; x64; rv:120.0) Gecko/20100101 Firefox/120.0" "Time: 311 microsecs"
127.0.0.2 - - [20/Jun/2024:08:37:47 +0000] [1508] "GET /logon/LogonPoint/plugins/ns-gateway/ns-nfactor.js HTTP/1.1" 304 - "-"          "Mozilla/5.0 (Windows NT 10.0; Win64; x64; rv:120.0) Gecko/20100101 Firefox/120.0" "Time: 315 microsecs"
127.0.0.2 - - [20/Jun/2024:08:37:47 +0000] [1508] "GET /vpn/media/citrixgateway_logo_white.png HTTP/1.1" 304 - "-" "Mozilla/5.         0 (Windows NT 10.0; Win64; x64; rv:120.0) Gecko/20100101 Firefox/120.0" "Time: 358 microsecs"
<!--NeedCopy-->
Export management logs
You can export management logs from NetScaler to industry standard log aggregator platforms such as Splunk. For more information, see Export management logs directly from NetScaler to Splunk.
Troubleshoot issues related to management logs
Even after you configure export of management logs, there might be some issues that prevent management logs getting exported to the observability endpoints. This section provides tips for troubleshooting issues related to the following scenarios:
- Management logs are not getting exported to the syslog server
- Management Logs not seen on Splunk (HEC)
- Common troubleshooting tips when management logs are not seen on any observability endpoint
Management logs are not getting exported to the syslog server
When management logs are not getting exported to the syslog server, do the following:
-
Check if you have enabled some management logs on the syslog action.
Scenario
John, a system administrator, ran the
show syslogaction ns-mgmt-logs-actcommand. In the output, he foundmanagementlog: NONEandmgmtloglevel: NONE, which confirmed that management logs were not enabled.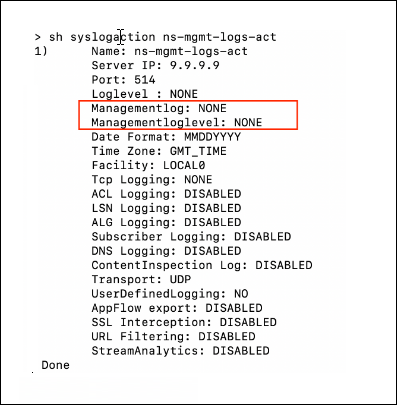
To fix this issue, he enabled management logs and management log levels by running the following command:
add syslogaction ns-mgmt-logs-act 9.9.9.9 -loglevel none -mgmtlogLevel all -managementlog all
<!--NeedCopy-->
After enabling, he ran the
show syslogaction ns-mgmt-logs-actcommand and verified that the management logs were enabled as highlighted in the following output.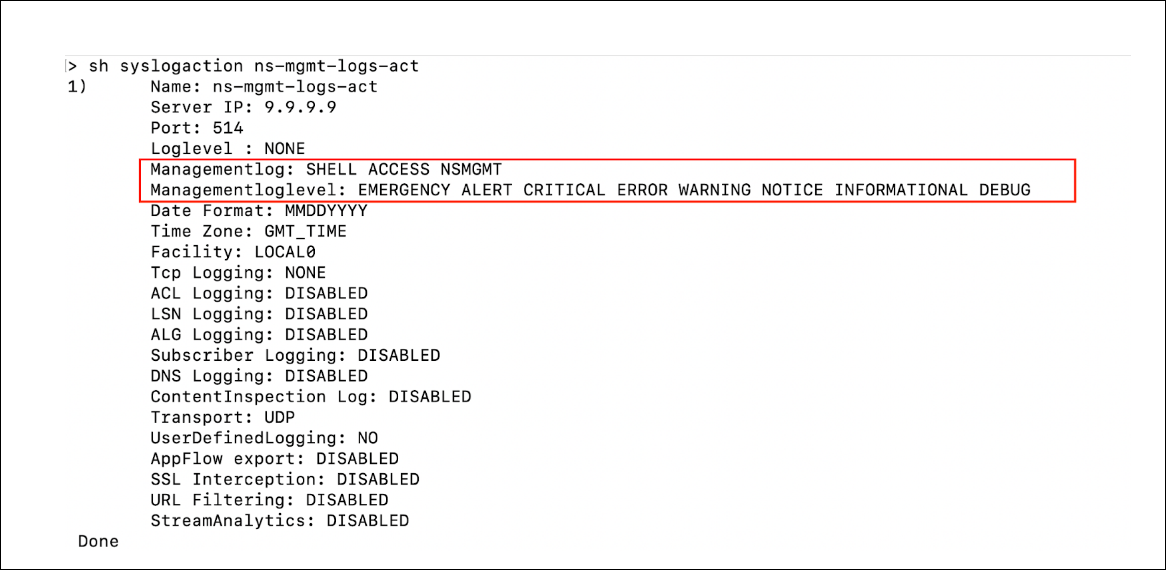
-
Check if the configured logs are generated locally. For example, if you’ve configured management logs with INFO severity, check if
/var/log/ns.logcontains management logs (lines that do not contain ‘-PPE-’) generated with INFO severity. The following are a couple of scenarios:Scenario 1
Cassidy, a system administrator, added the following action that had only NSMGMT warning logs enabled and found that the logs were not getting generated.
add syslogaction ns-mgmt-logs-act 9.9.9.9 -loglevel none -mgmtlogLevel warning -managementlog NSMGMT
<!--NeedCopy-->
Cassidy looked at the local log files
ns.logandnotice.logand found that warning level messages were not generated.root@ns# cat /var/log/ns.log | grep -v -e '-PPE-' Jun 26 05:00:00 ns newsyslog[74791]: logfile turned over due to size>100K rootQns# cat /var/log/notice.log | grep warn Jun 26 05:08:34 <local7.notice> ns bash[81962]: root on /dev/pts/5 shell_command="cat /var/log/notice.log | grep warning" Jun 26 05:08:40 <local7.notice> ns bash[81962]: root on /dev/pts/5 shell_command="cat /var/log/notice.log | grep warn" Jun 26 05:09:15 <local7.notice> ns bash[81962]: root on /dev/pts/5 shell_command="cat /var/log/notice.log | grep warn" <!--NeedCopy-->Scenario 2
John, a system administrator, added the following action that had all management logs enabled for all levels.
add syslogaction ns-mgmt-logs-act 9.9.9.9 -loglevel none -mgmtlogLevel all -managementlog all
<!--NeedCopy-->
The logs were getting generated locally in the
bash.logand therefore, the same appeared at their observability endpoint as well.root@ns# tail -f /var/log/bash.log Jun 26 05:16:54 <local7.notice> ns bash[4278]: root on (null) return_code="l" Jun 26 05:16:54 <local7.notice> ns bash[5909]: root on (null) shell_command="true" Jun 26 05:16:54 <local7.notice> ns bash[5909]: root on (null) shell_command="curl 10.102.154.54; sleep 0.5" Jun 26 05:16:54 <local7.notice> ns bash[5909]: root on (null)shell_command="curl 10.102.154.54" <!--NeedCopy--> -
Check and confirm the following:
- If you are using the correct transport protocol
- If you are using the correct IP address or domain name
- If you are using the correct load balancing configuration
- If the domain name is resolved
- If the service or the virtual server is UP
-
Check and confirm that the policy is created with ‘true’ rule and bound to system global. If the binding is not present, the logs are not exported.
Scenario
Cassidy, a system administrator, ran the
show syslogglobalcommand and noticed that the policy was not bound to system global.> show syslogglobal Done <!--NeedCopy-->Cassidy ran the following command to bind the policy to system global:
bind syslogGlobal -policyName ns-mgmt-logs-pol -priority 1 Done
<!--NeedCopy-->
After binding, the
show syslogglobalcommand showed the binding details.> sh syslogglobal 1) Policy Name: ns-mgmt-logs-pol Priority: 1 GlobalType: SYSTEM_GLOBAL Done <!--NeedCopy--> -
Check management log counters. You can run
shell nsconmsg -g mgmt_push -g mgmtlog -d current. For example, if you seemgmtlog_tot_send_syslog_failures_due_to_server_not_up incrementin the output, it indicates that the logs were not sent because the server was not up. -
Run
nstraceto check the UDP or TCP flow for any abnormalities. Check if the endpoint is configured to use TLS or SSL but NetScaler is actually sending unencrypted data or conversely.
Management logs not seen on Splunk (HEC)
When management logs are not getting exported to Splunk (HEC), perform the following:
-
Check if you have enabled management logs on a time series profile. To check, run the
show analyticsprofile <profilename>command and see the output.Scenario
Cassidy, a system administrator, realized that she actually needed the JSON format and not the syslog format. Therefore, she removed all management syslog configurations and added analytics configurations. However, she saw that the logs were not going out of NetScaler. When she ran the
show analyticsprofile <name>command, she sawManagementlog: NONEin the output and realized that she had forgotten to enable management logs on the analytics profile.To fix the issue, she enabled management logs using the
set analytics profile <name> -managementlog ACCESS. With this fix, she saw that the logs were sent out of the NetScaler and also theshow analyticsprofile <name>command showedManagementlog: ACCESS.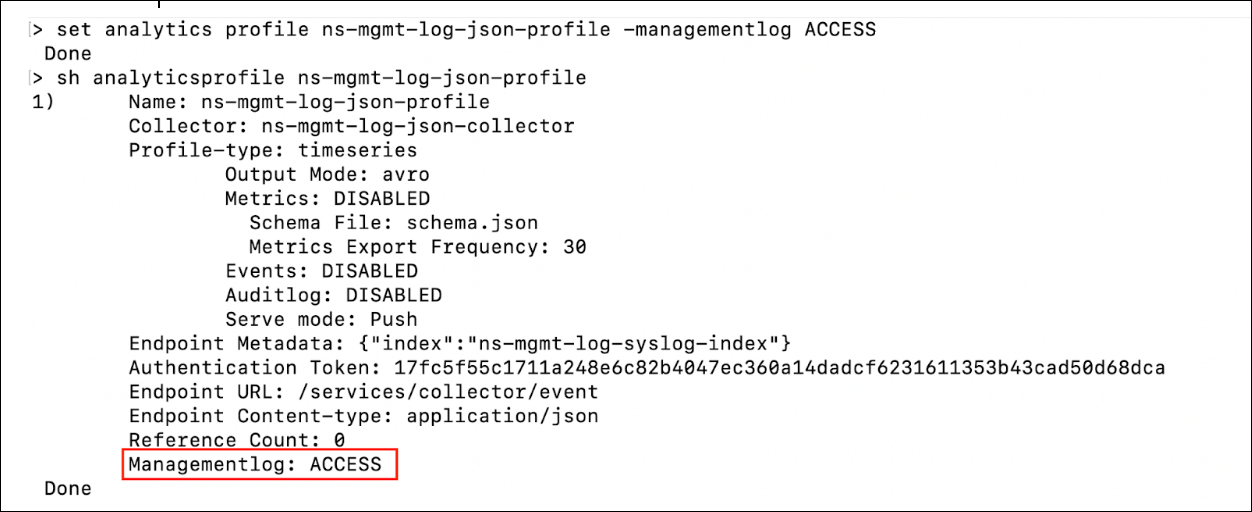
-
Check if the configured logs are actually being generated locally. For example, if you’ve configured NSMGMT management logs, you can check if
/var/log/ns.loghas management logs (lines that do not contain ‘-PPE-’) generated. -
Check and confirm the following:
- If you are using the correct profile. You must use the time series profile.
- If the service is resolved and is UP.
- If metadata (-analyticsEndpointMetadata) is properly configured and is a valid JSON and also if all the fields contained in it are present in the logs exported to Splunk.
- If the Splunk Auth Token is correct. Because the auth token is not displayed, you have to ensure it is entered correctly in the format
-analyticsAuthToken ‘Splunk <token>’.
-
Run the
shell nsconmsg -g mgmt_push -g mgmtlog -d currentcommand and check for management log counters. For example, if you seemgmtlog_tot_json_non_2xx_http_responses increment, then it indicates that the logs failed to reach Splunk because it responded with non-2XX response. -
Run
nstraceto check the TCP or HTTP flow for any abnormalities. Check if the endpoint is configured to use TLS or SSL but NetScaler is sending unencrypted data or conversely. You can further check if the exported JSON is not malformed.
Common troubleshooting tips when management logs are not seen on any observability endpoint
If the tips provided in the Management logs are not getting exported to syslog server and Management Logs not seen on Splunk (HEC) sections do not resolve your issue, perform the following:
-
Look at the following log files related to the process that exports management logs. These log files might give you an idea about the issue:
- /var/log/export_mgmtlog_status.log
- /var/log/export_mgmtlog_cron.log
Scenario: Cassidy, a system administrator, saw broken pipe errors in
export_mgmtlog_status.logand found that their collector was sending resets because of firewall issues, which was rectified at their end.Fri May 10 04:02:15 2024 do_logexport.py ERROR Traceback (most recent call last): File "/netscaler/do_logexport.py", line 505, in netio_send pe_socket.sendall(data) BrokenPipeError: [Errno 32] Broken pipe <!--NeedCopy--> -
Check if the configuration file
/nsconfig/mgmtlogcfg.jsonis properly generated and also check if it hints to contain Syslog or JSON related configuration.For example, when both Syslog and JSON are configured, the
/nsconfig/mgmtlogcfg.jsonfile looks as shown below. The“syslog”field confirms that syslog is configured, while the“json”field confirms that json is configured.root@ns# cat /nsconfig/mgmtlogcfg.json {"syslog":{"typemask":7,"levelmask":127,"ip":"127.0.0.2","port" :5566},"json":[{"name":"ns-mgmt-log-json-profile","typemask":2,"ip":"127.0.0.2","port":5563,"metadata":"{\"index\":\"ns-mgmt-log-syslog-index\"}"}]} <!--NeedCopy--> -
Ensure that you are looking at the correct index and the correct timestamp.
Scenario
Cassidy, a system administrator, realized that she configured syslog index named
ns-mgmt-log-syslog-indexinstead ofns-mgmt-log-json-indexon Splunk, which was later rectified.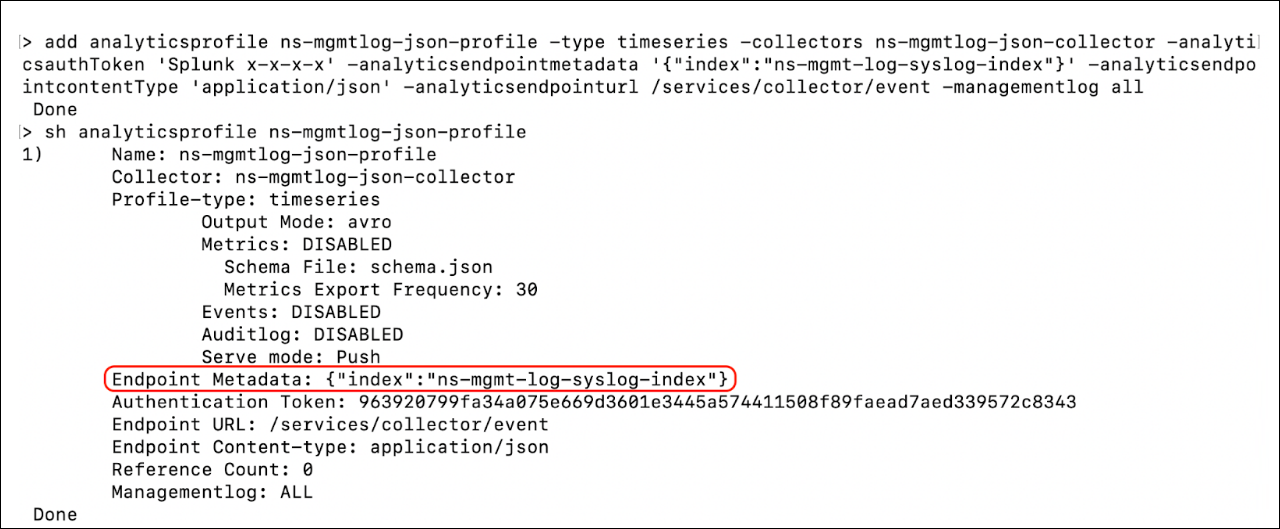
-
On cluster deployments, if the logs are not going out of non-CCO nodes, try running the
force cluster synccommand. -
HA deployments: You might notice that the secondary node is not sending logs by default. If you are exporting JSON, then you can enable the appflow param
TimeseriesOverNSIPto allow a secondary node to send logs using the NSIP address to the collector, if the latter is reachable using the NSIP address (SNIP addresses cannot export logs out of secondary nodes). If you are exporting Syslog, then you can use a load balancing virtual server instead to export information out of secondary nodes. -
Netprofiles: It is also possible to use netprofiles. For syslog, ensure that you have set the ‘-netprofile’ on the syslog action. If you are load balancing syslogs or you are exporting them in JSON format, then ensure that you have set the netprofile on the service.
-
Partitions: Management logs feature is not supported on non-default Partitions.
-
Timestamps: Management logs generated by the processes are periodically exported. Hence, the time you receive the management log might not be the same as the time it was generated. Also, the date format might not comply with what’s configured on the action as management logs exported in syslog format comply with RFC 5424.
Log levels
In NetScaler, log levels categorize the severity and type of log messages generated. These levels help administrators filter and prioritize logs for monitoring, troubleshooting, and auditing. Below are the log levels supported by NetScaler:
-
ALERT - Requires immediate action to prevent further issues. These are high-priority messages.
-
CRITICAL - Indicates a critical condition that might affect the system’s functionality.
-
EMERGENCY - Indicates a critical system failure that requires immediate attention. The system is likely unusable.
-
ERROR - Logs errors that have occurred but do not necessarily require immediate action.
-
INFORMATIONAL - The informational logs provide general information about NetScaler.
-
NOTICE - Provides informational messages about normal but significant events.
-
WARNING - Indicates potential issues or situations that could lead to problems if not addressed.
-
DEBUG - The debug logs provide detailed information for troubleshooting.
-
ALL - Includes all log levels except DEBUG.
-
NONE - Does not contain any log details.
Note:
Starting from NetScaler release 14.1-47.x onwards, DEBUG log level is removed from local syslog. The ALL option does not include DEBUG log level. If you want to enable DEBUG explicitly, you can use the following hidden option in the CLI:
set syslogparams -loglevel -debug.Enabling the DEBUG log level is not persistent across reboots and therefore the setting is lost after a system restart. You must re-enable the DEBUG log level manually if needed.
Share
Share
This Preview product documentation is Cloud Software Group Confidential.
You agree to hold this documentation confidential pursuant to the terms of your Cloud Software Group Beta/Tech Preview Agreement.
The development, release and timing of any features or functionality described in the Preview documentation remains at our sole discretion and are subject to change without notice or consultation.
The documentation is for informational purposes only and is not a commitment, promise or legal obligation to deliver any material, code or functionality and should not be relied upon in making Cloud Software Group product purchase decisions.
If you do not agree, select I DO NOT AGREE to exit.